Solar Power Plants to Account for 11% of 2023 Production
Solar power plants are projected to account for 11 percent of 2023 production.
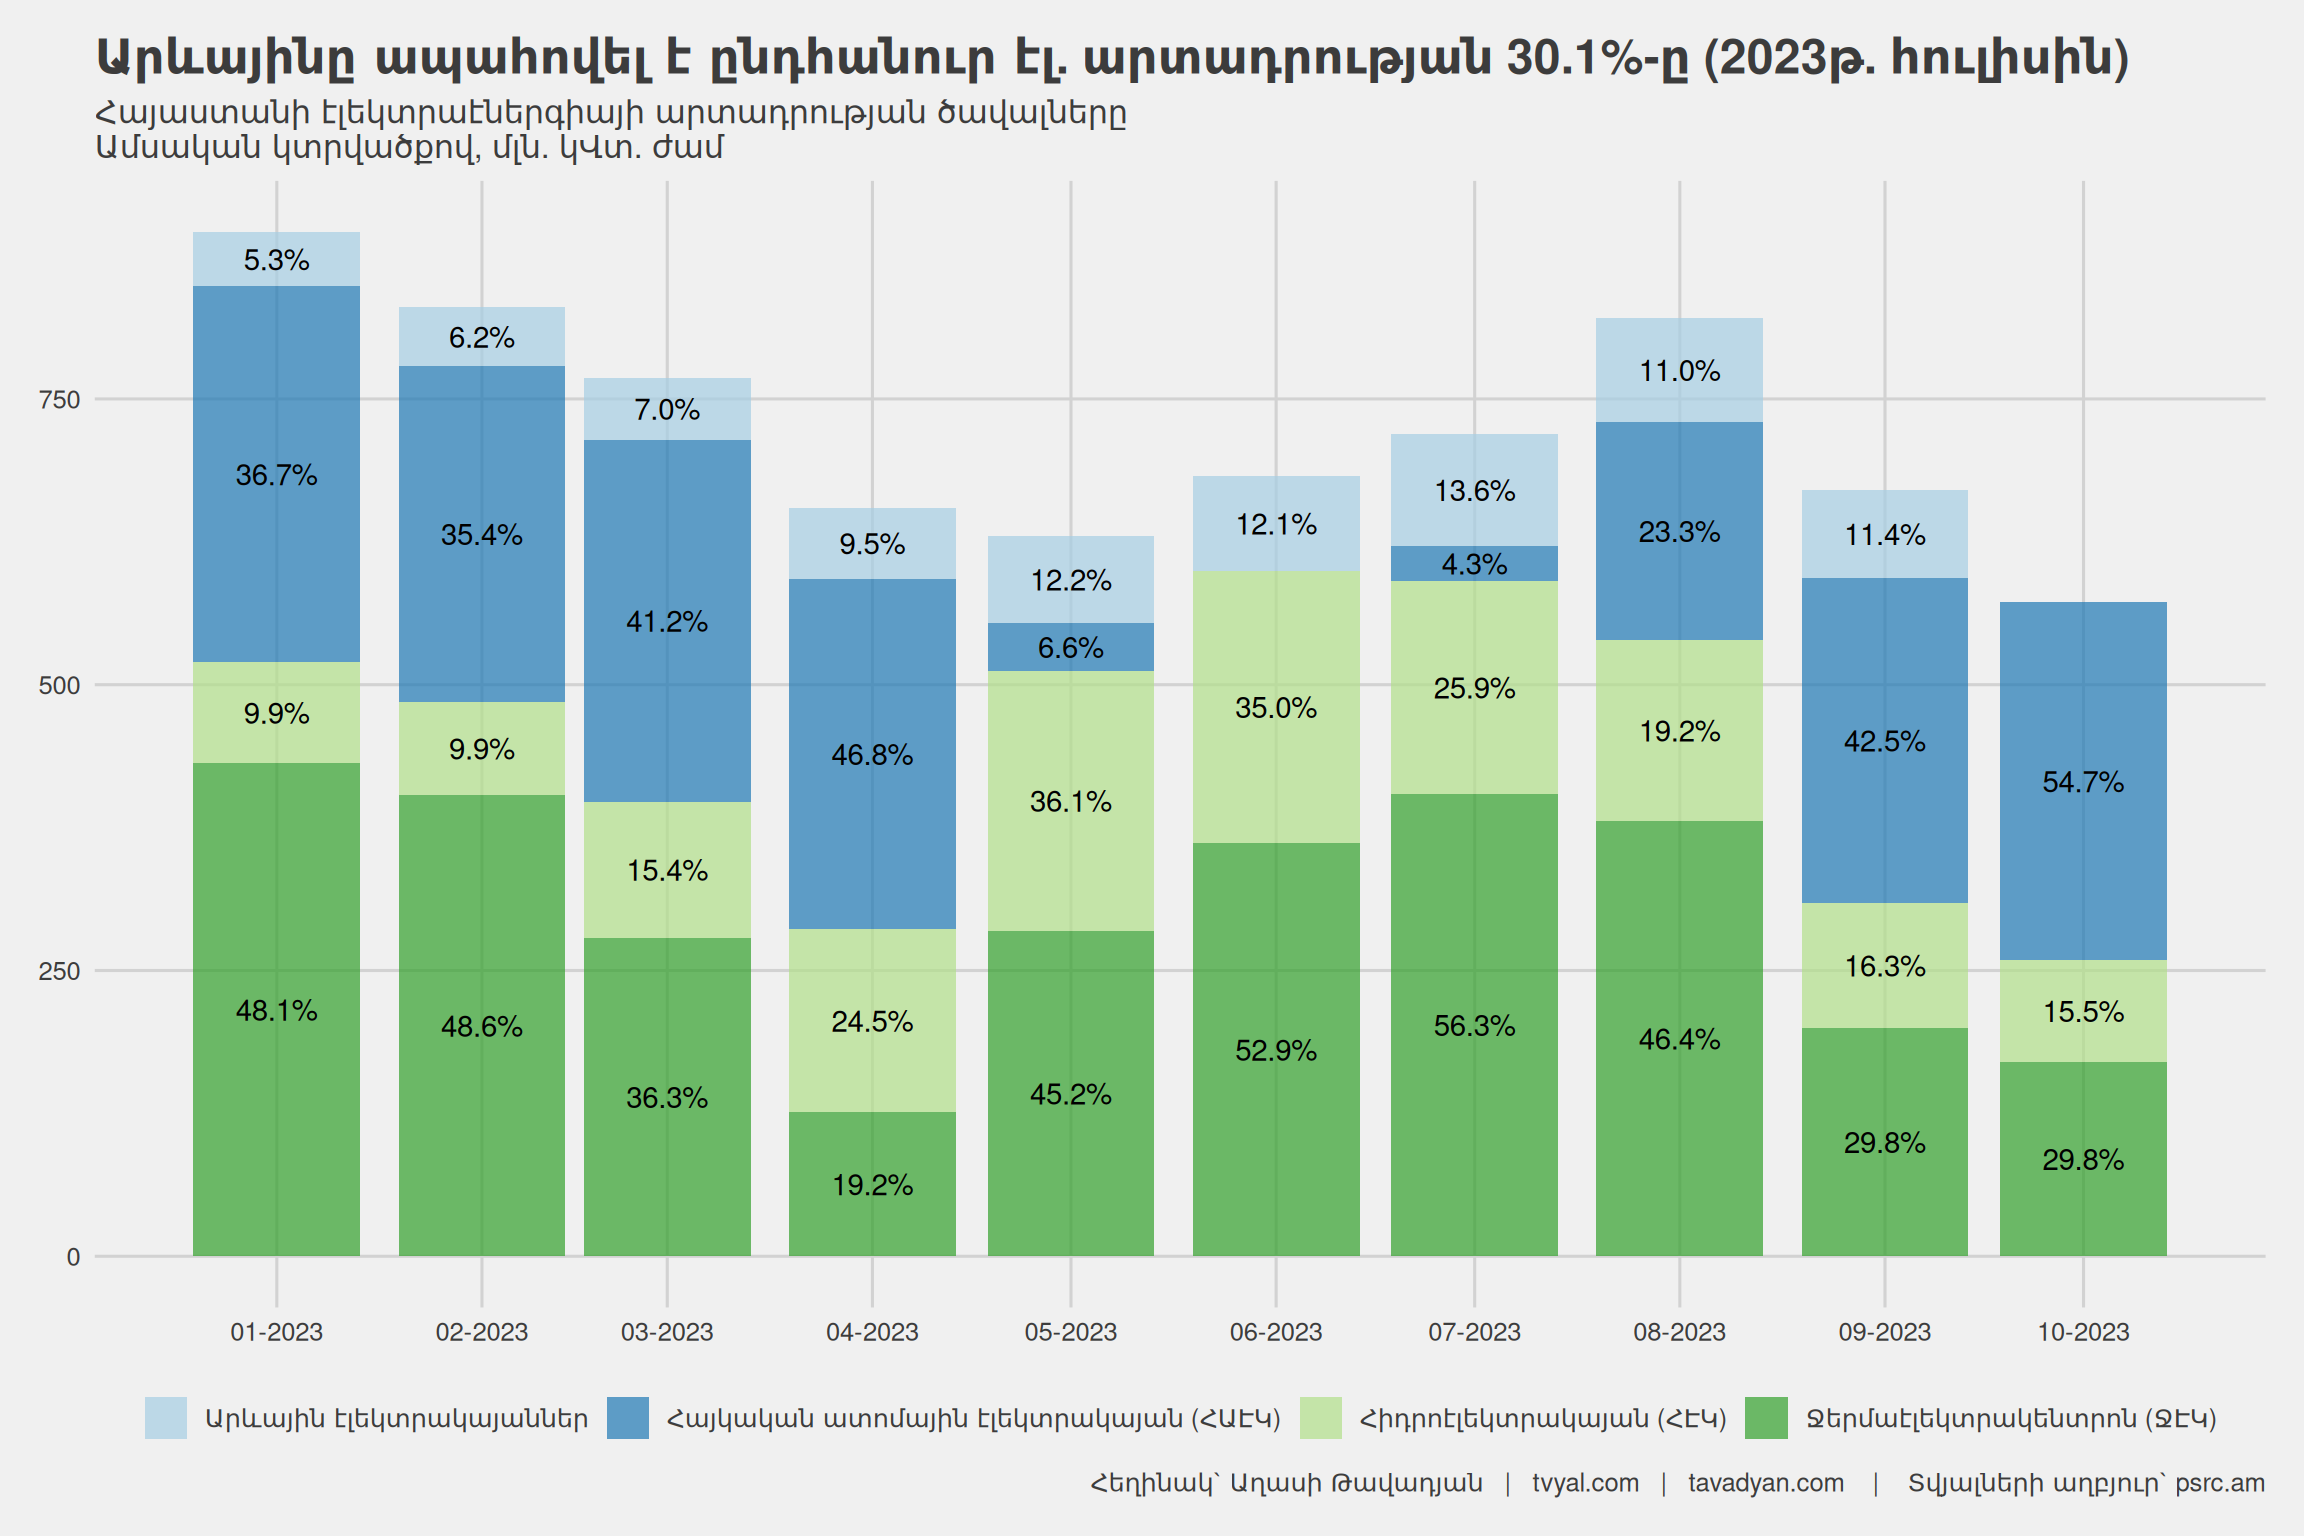
The first chart illustrates monthly electricity production in Armenia by plant type for 2023. Interestingly, solar energy provided 13.6% of total electricity production in July 2023. This demonstrates the real potential of solar energy. ️For the first 9 months of 2023, solar energy accounted for 9.3% of total production, or 680.8 million kWh.
Chart 1. Monthly electricity production in Armenia
For a landlocked country heavily dependent on imported fossil fuels, solar energy becomes crucial for several reasons. First, solar energy provides a decentralized source of power, reducing reliance on external suppliers and improving energy security. It’s worth noting that in 2022, 43 percent, or 3,878.7 million kWh, was produced by thermal power plants (TPPs), which use gas imported from Russia for electricity generation and are the most expensive source of electricity in the domestic market. By utilizing solar energy, Armenia can significantly reduce its vulnerability to geopolitical tensions, price fluctuations, and supply disruptions related to imported gas.
The second chart reflects annual electricity production by type of power plant. The lower part of the chart shows the percentage shares of production for each year. For example, in 2015, TPPs provided 35 percent of electricity production, the Armenian Nuclear Power Plant (ANPP) 32 percent, and hydropower plants (HPPs) 28 percent. In 2022, these figures were 43, 32, and 22 percent respectively, while solar power plants still accounted for only 3 percent.
The chart also presents forecasts for 2023 and 2024 using two models (AUTO.ARIMA and BATS), including the uncertainty interval. Both forecasting methods are equivalent for 2023, predicting that solar electricity will constitute 10-11 percent of total production this year. In 2024, solar electricity is expected to provide 12-14 percent of the total.
Chart 2. Annual electricity production volumes and forecast
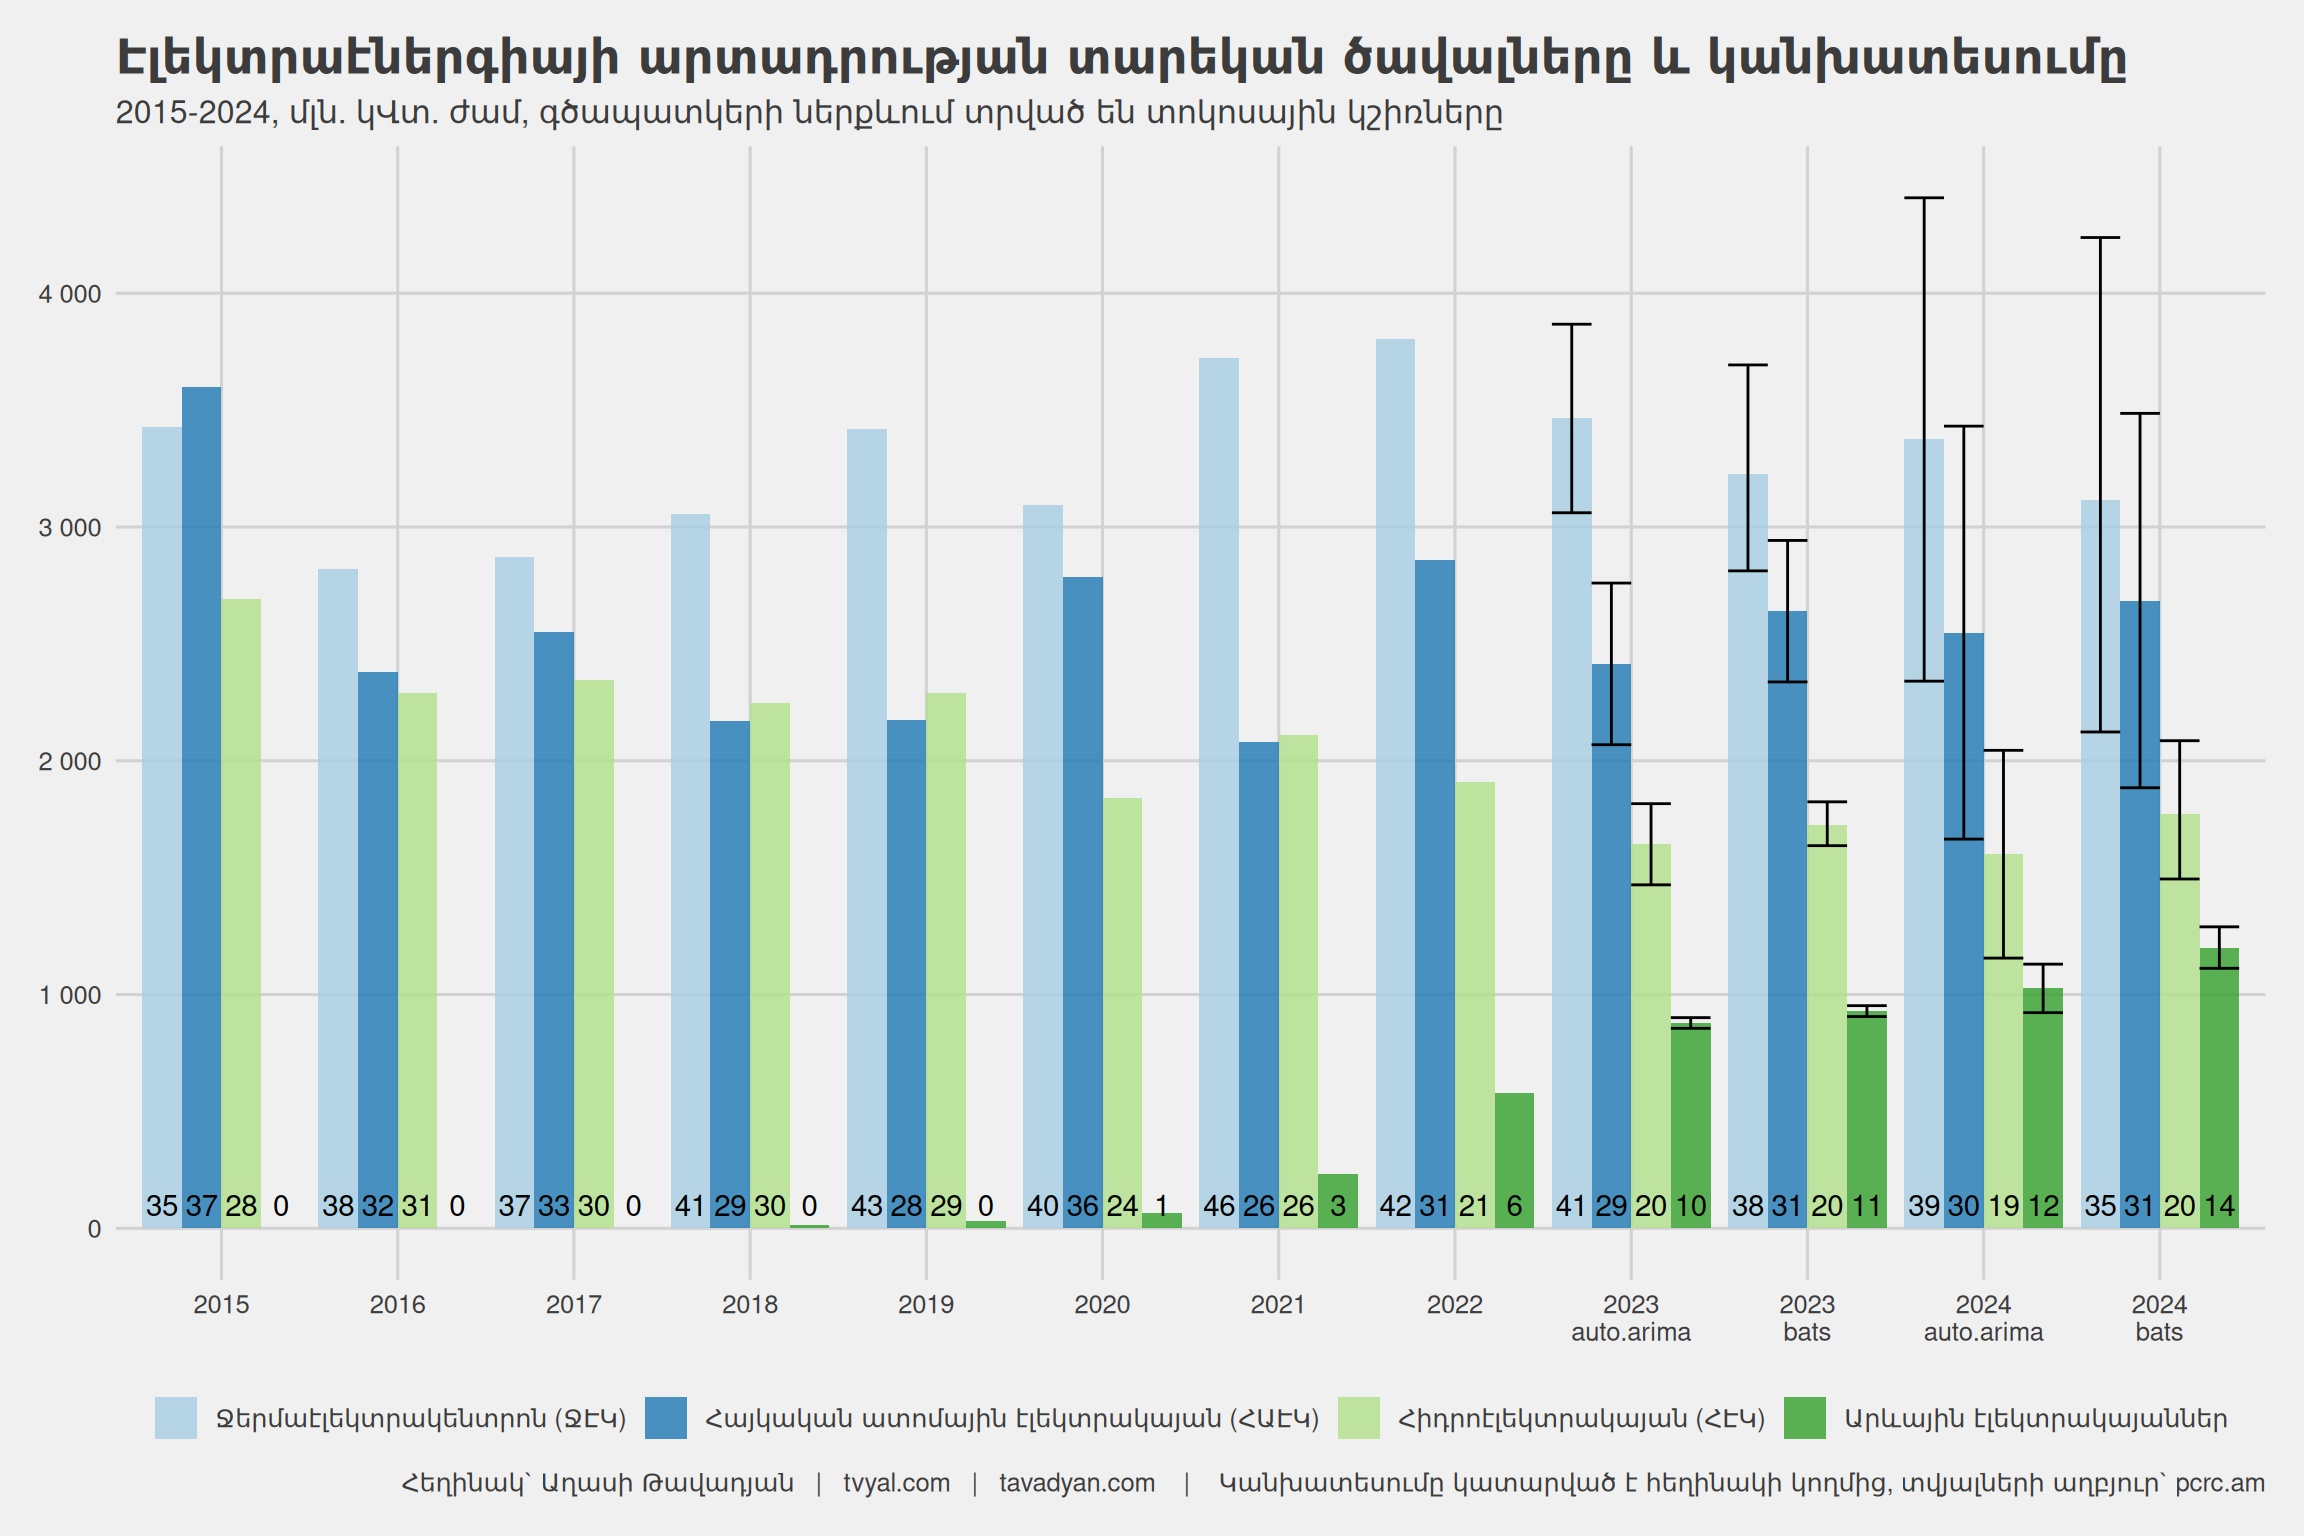
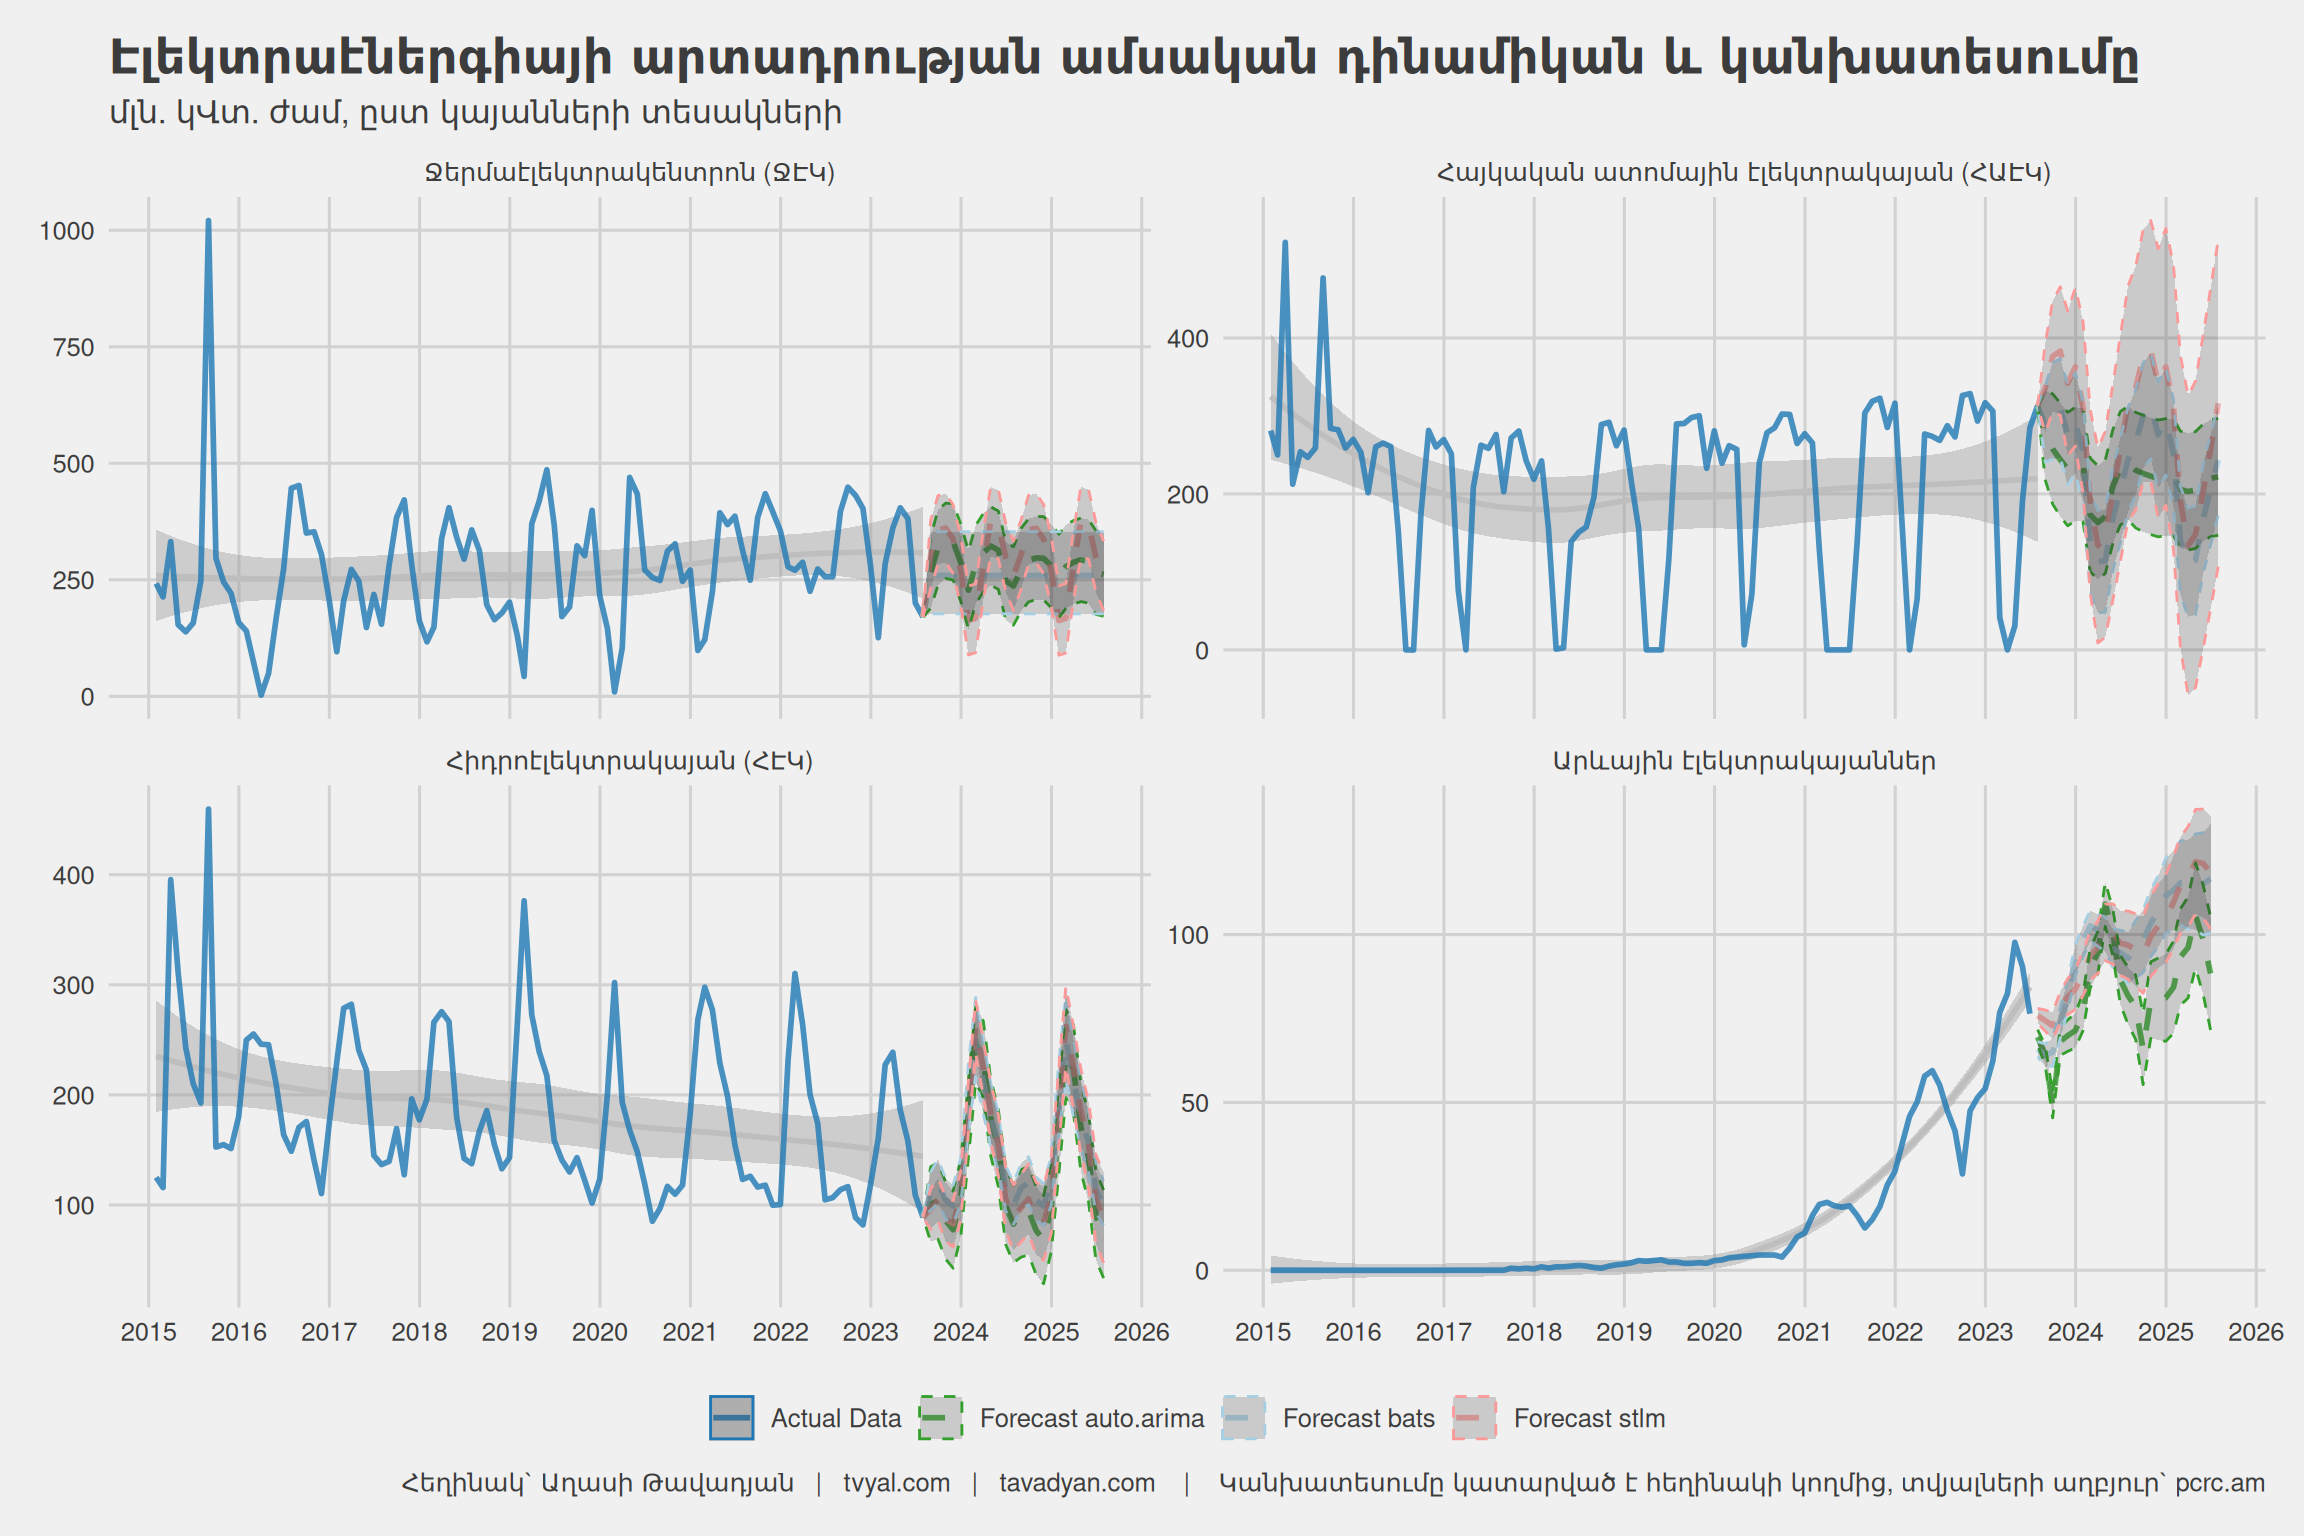
Chart 3 displays the monthly volumes of electricity produced in Armenia by type of power plant. The chart also includes a two-year forecast up to 2026.
The Hrazdan Thermal Power Plant (TPP), which currently produces the most electricity, shows an unchanging, stable growth trend. No overall changes in electricity production are expected in this sector.
The chart shows the planned seasonal shutdowns of the Armenian Nuclear Power Plant, which have been scheduled since 2016, aimed at restarting and extending the plant’s operational life.
Hydropower plant production shows a declining trend. While in 2017, an average of about 200 million kWh of electricity was produced monthly, in 2023, it’s already about 150 million kWh per month. The trend here depends on the seasonality of water intake, which is also reflected in the forecasts.
Armenia is currently on an exponential growth curve for solar electricity. The chart clearly shows the growth and seasonality of solar electricity. In 2024, solar power plants are expected to provide about 12-14 percent of electricity production, which will almost equal the output of hydropower plants.
Chart 3. Monthly dynamics and forecast of electricity production
Soon, most of the energy demand will clearly be met by solar electricity. Additionally, home heating and car charging will be done with electricity. The latter will increase the demand for electricity. We must be prepared for demand to potentially double or more. Electricity production volumes in Armenia need to increase at least twofold. This means that within a few years, Armenia’s electrical infrastructure must be ready to provide 18,000 million kWh of electricity annually. The potential doubling of demand and supply could strain the electrical infrastructure, which urgently needs updating.
Liquid Gas Price at the Border
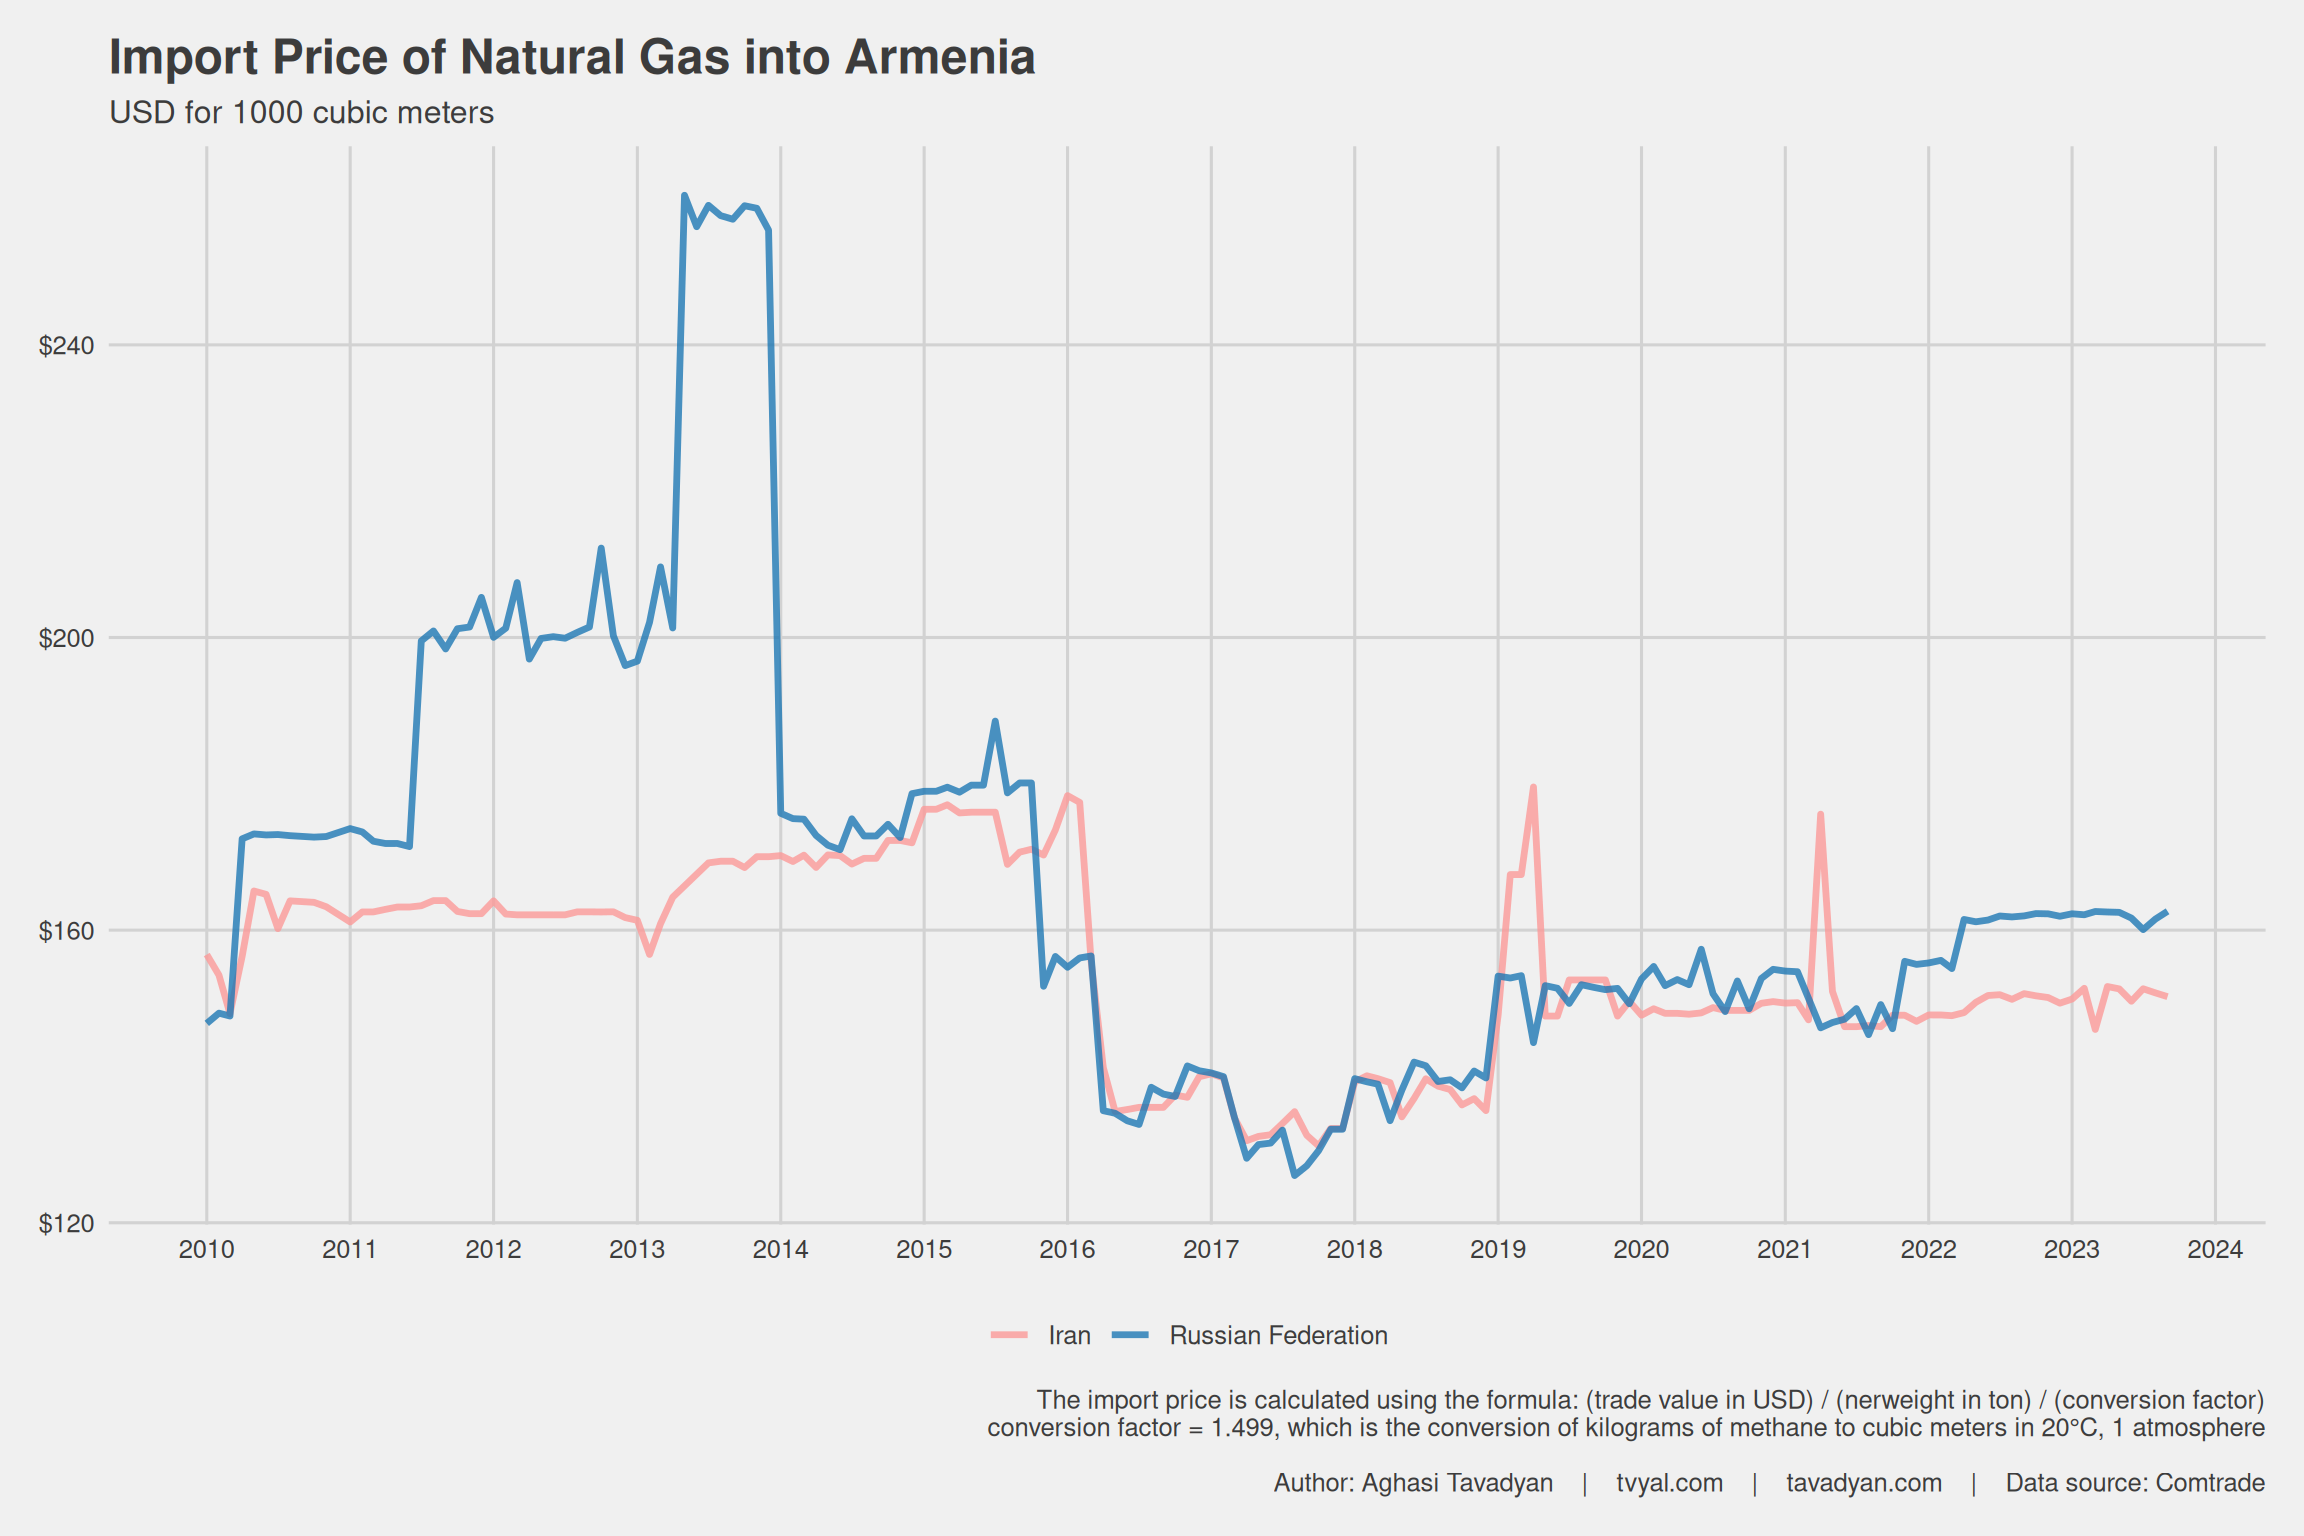
As a bonus, we also present the change in the price of liquid gas at the Armenian border.
Chart 4. Liquid gas price at the border
Error Correction
An error in forecasting was present in the initial version of this material. The reason for this is that since July 2023, the electricity production volumes published by the Statistical Committee also include the volumes of electricity produced by autonomous producers as part of electricity transfers. The database obtained these reports by automatically downloading them from the internet and through automated calculation within the database, where the monthly data was derived by subtracting the previous month’s cumulative sum from the current month’s cumulative sum.
Due to this circumstance, the solar electricity production data for June 2023 in the initial version of this material also included the commercial production volumes for that month, as well as the volumes of electricity produced by autonomous producers from the beginning of 2023 up to and including June.
In the previous version of this analysis, all charts, calculations, forecasts, and text have now been corrected. The old version will not be deleted and will be available under this link.