The Transition from Agriculture to Industry
Or, Agriculture Has Collapsed
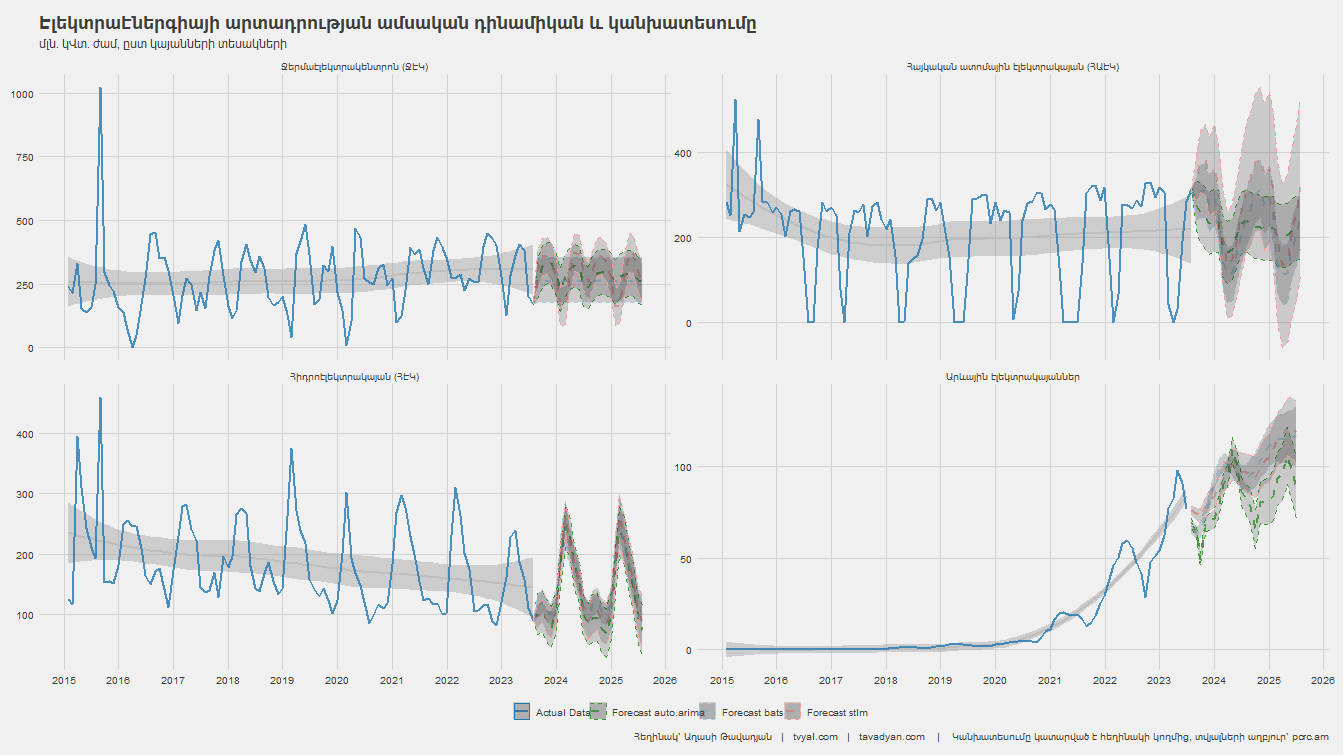
Overall, in these 10 years, GDP has more than doubled, amounting to 6.38 trillion drams in 2013, and in 2023, GDP is expected to exceed 13 trillion drams. Ten years ago, in 2013, agriculture accounted for 19.5 percent of Armenia’s GDP, totaling 1.24 trillion drams, while industry was in second place, making up 14.3 percent of GDP, or 920 billion drams.
In 2023, the picture is reversed: industry now holds the first place, providing 17.3 percent of GDP, while agriculture’s share has dropped from nearly 20 percent to 10.2 percent over these 10 years.
It is noteworthy that over these 10 years, GDP has grown by more than 2 times, while agriculture has recorded almost no growth, increasing by a mere 5 percent. Industry has grown by 2.5 times in this 10-year period. Agriculture is now in 3rd place, after industry and wholesale and retail trade.
Let’s also consider the construction sector, whose share has decreased from 13 percent to 9.1 percent over these 10 years. This sector has recorded a 40 percent growth. Real estate activities (L) have grown by more than 2 times.
Figure 1. Change in the Output of Goods and Services in GDP
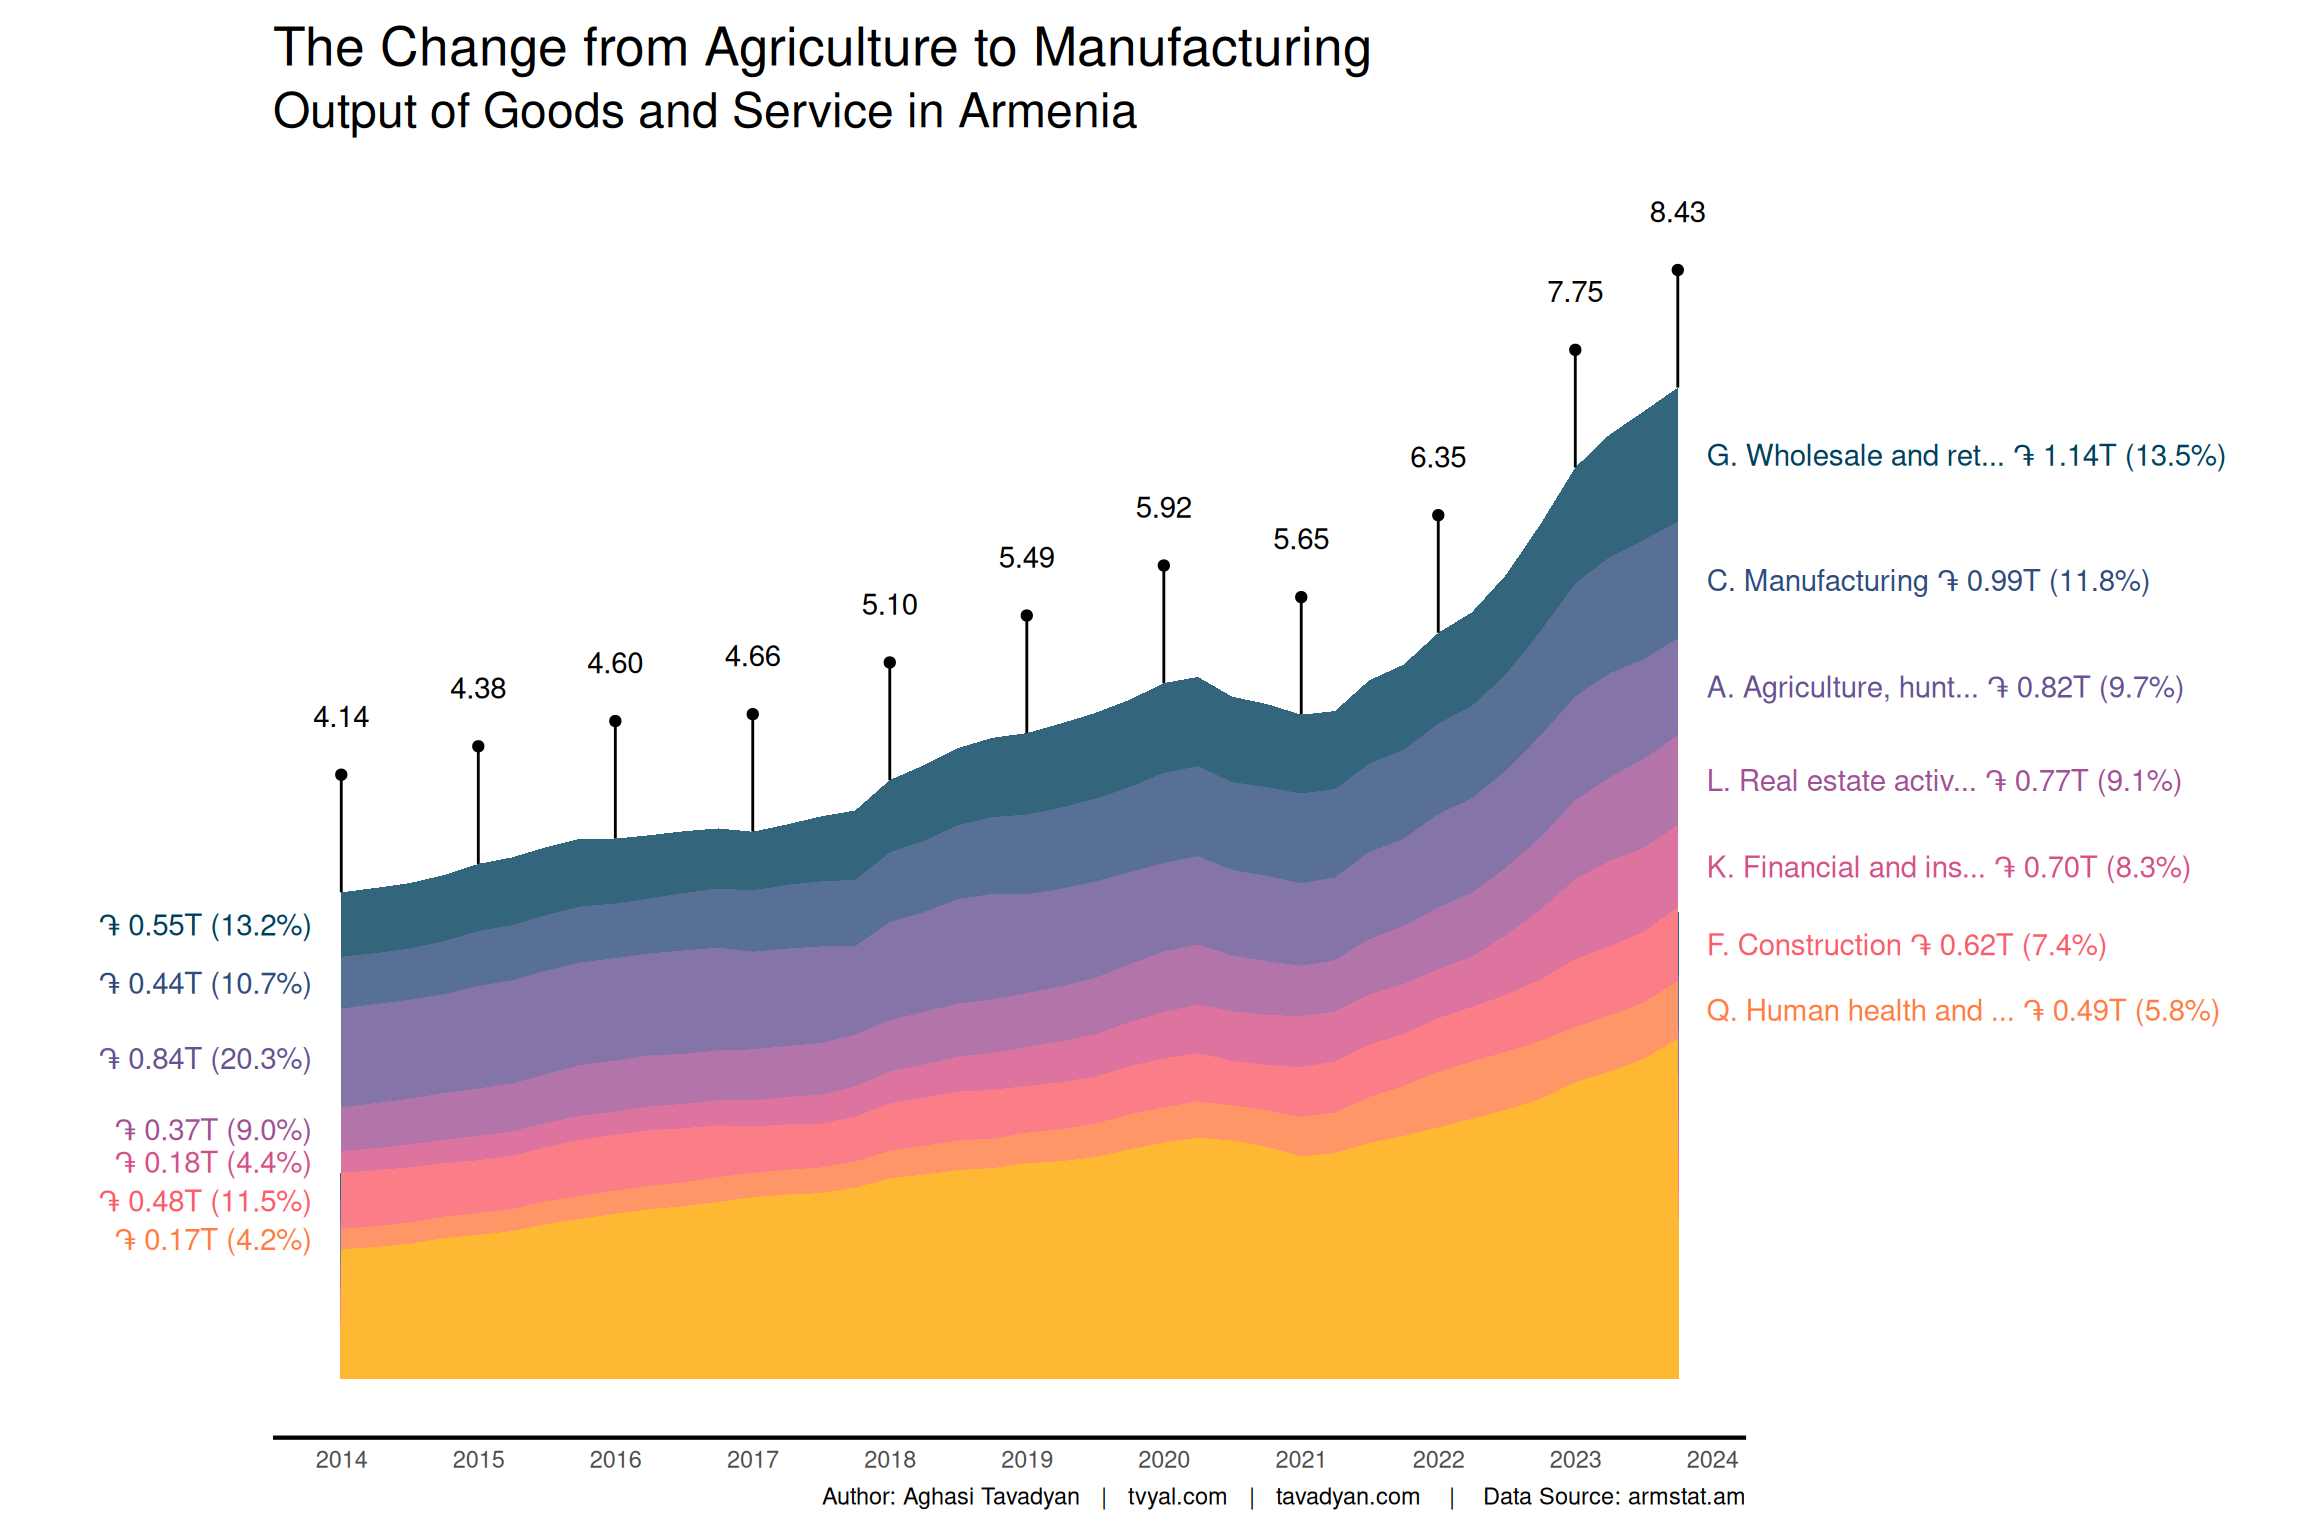
Let’s examine which branches of goods and services output have experienced the most significant growth over these 10 years.
As can be seen, the only sector that has remained almost the same over these 10 years is agriculture. This sector has not recorded any growth during this period. If we also consider inflation, the growth trend has been negative. In fact, almost all sectors have registered a 2-fold or more growth, except for agriculture.
The largest growth was recorded in the (I) Accommodation and Food Service Activities and (R) Arts, Entertainment, and Recreation sectors, which grew by more than 4.7 and 4 times, respectively, over these 10 years. This primarily speaks to the development of tourism in Armenia.
Financial and insurance activities have grown by more than 3.6 times.
- Note: In this study, the 2023 data represents the cumulative sum of the 1st, 2nd, and 3rd quarters of 2023, as well as the 4th quarter of 2022, which constitutes the annual value.
Figure 2. Comparison of GDP Structure Growth from 2013 to 2023
Correction of Errors
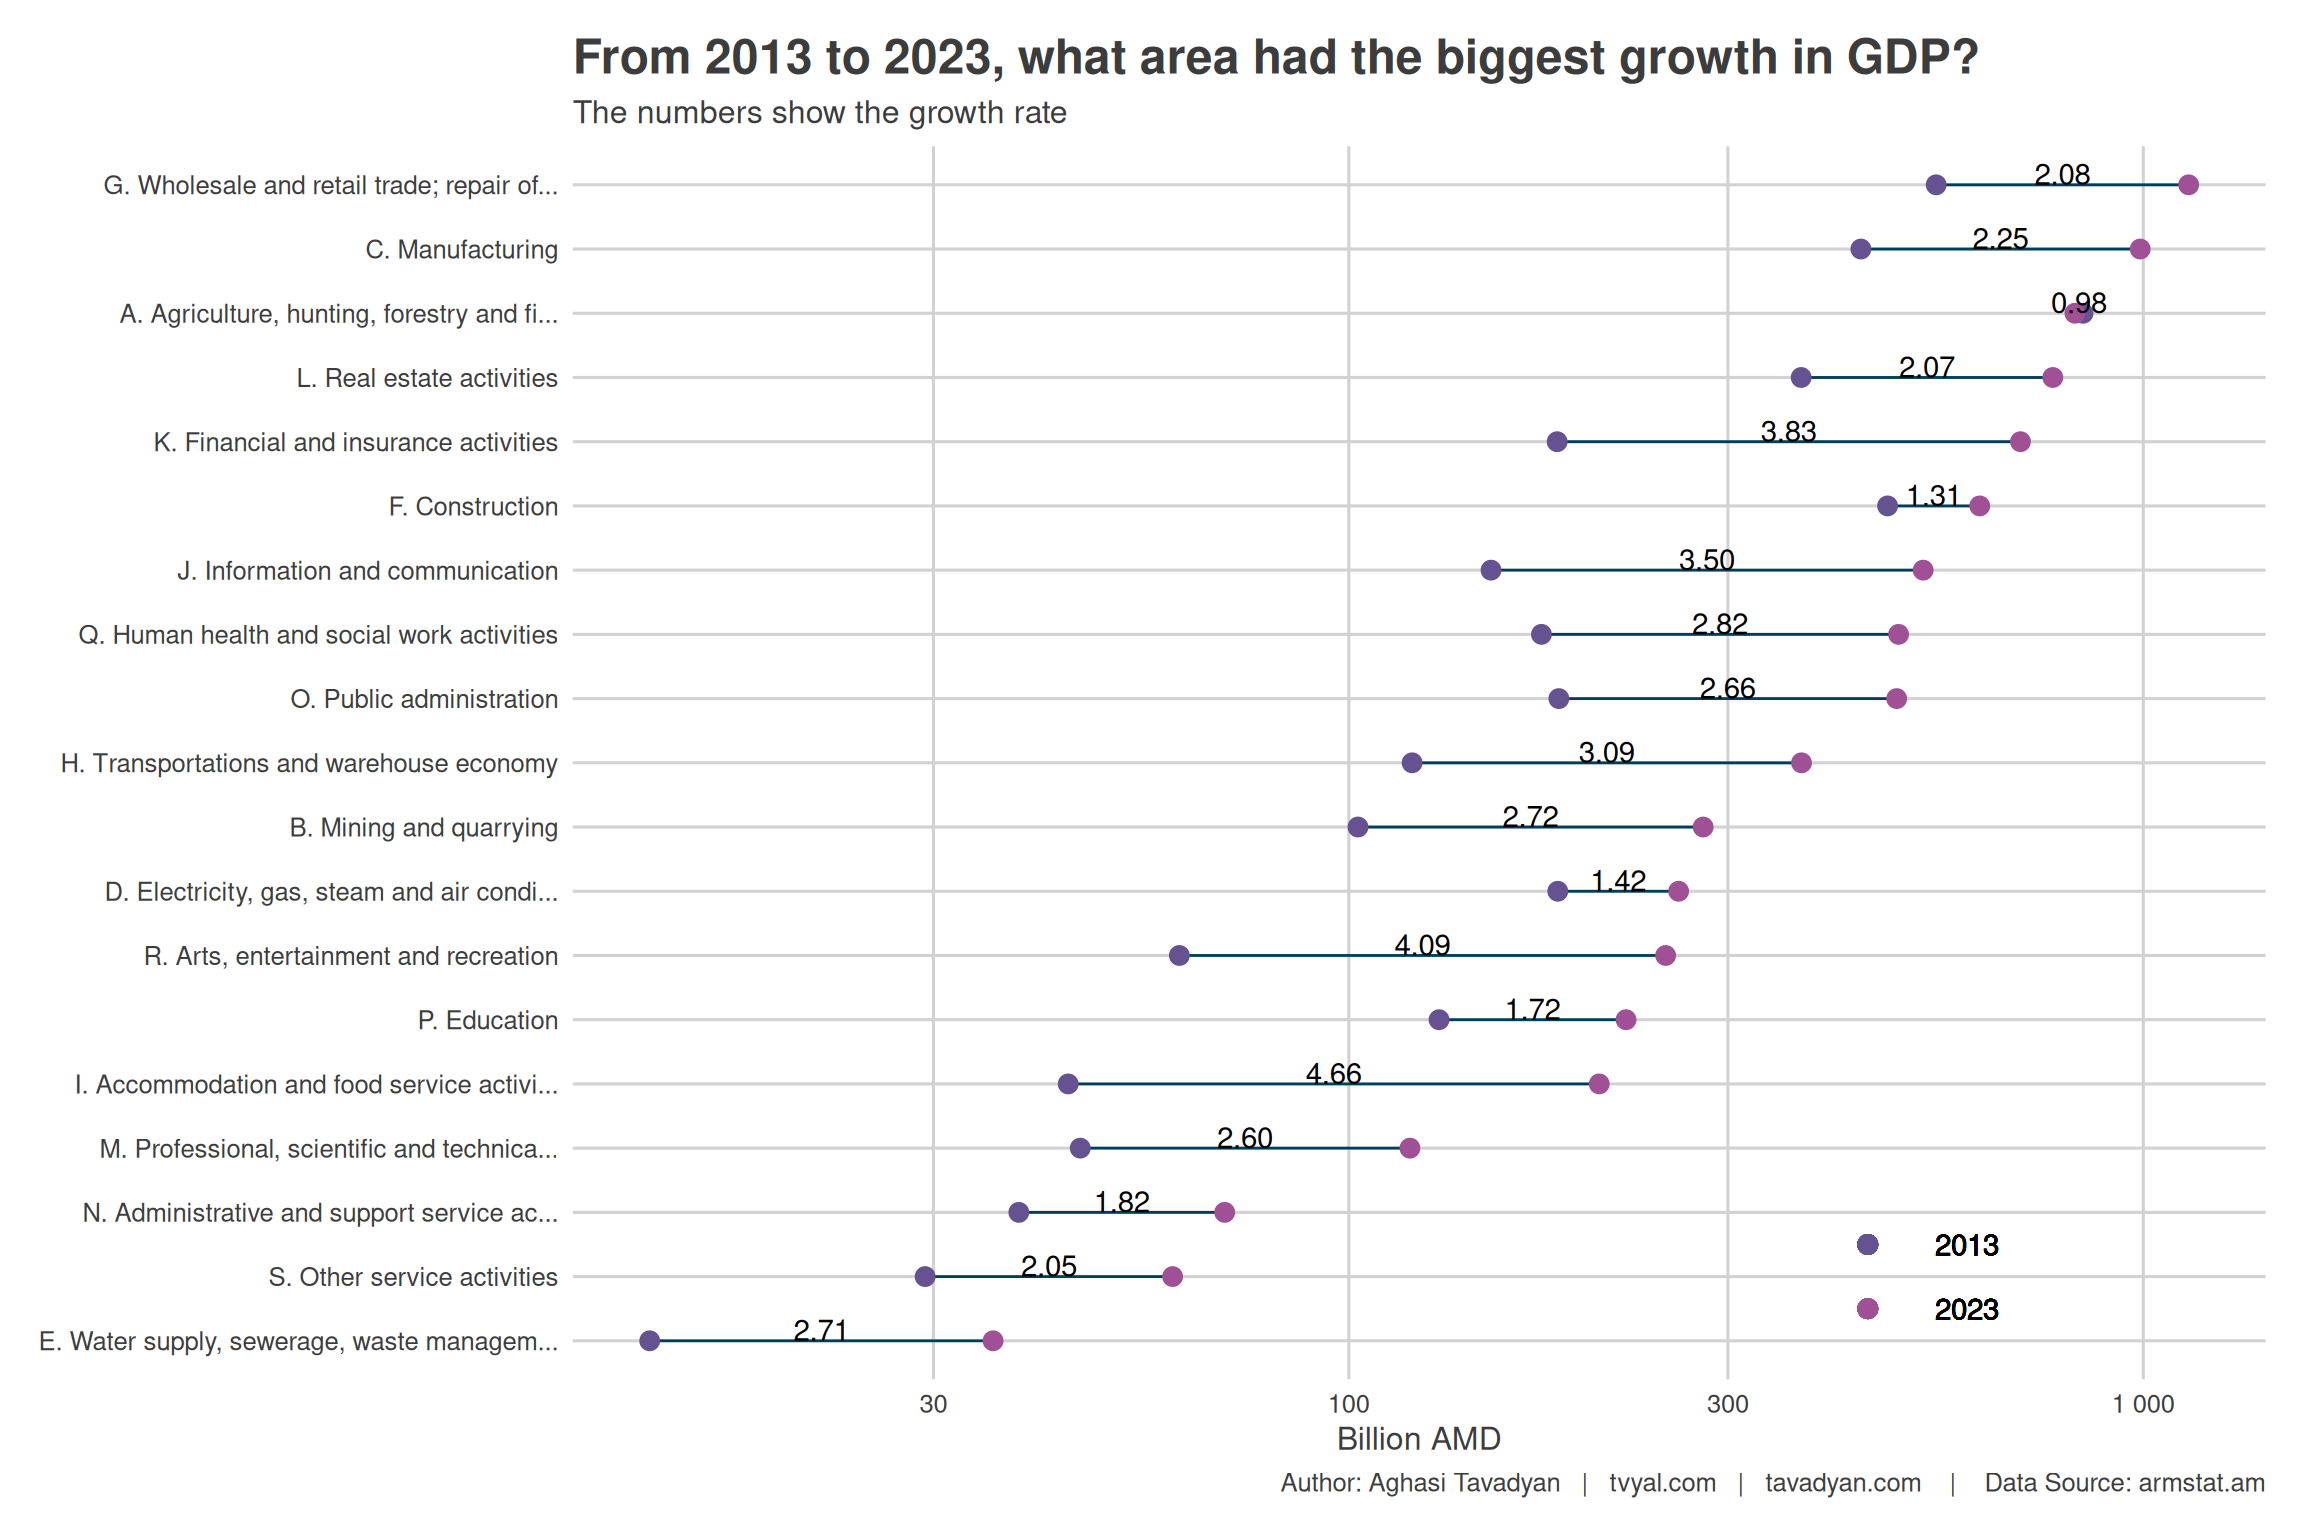
There was a forecasting error in the previous material, the reason being that since July 2023, the electricity production volumes published by the Statistical Committee also include the volumes of electricity produced by autonomous producers as part of electricity flows. The database obtained these reports by automatically downloading them from the internet and through automated calculation within the database, where the monthly data was derived by subtracting the cumulative sum of the previous month from the current month’s data.
Due to this circumstance, the solar electricity production data for June 2023 in the newsletter sent to you last week included the commercial production volumes for that month, as well as the volumes of electricity produced by autonomous producers from the beginning of 2023 up to and including June. This is why there was a sudden and non-recurring increase in the data for June 2023, which presumably accounted for about 30 percent of that month’s production. This is an error.
All charts, calculations, forecasts, and text in the previous analysis have now been corrected. Click this link to access the corrected version. The old version will not be deleted and will remain under this link.
The adjusted forecast for annual electricity production volumes reflected in the chart.
Figure 3. Annual Electricity Production Volumes and Forecast