Beyond the Average — Armenia's True Wage Distribution
The average monthly salary in Armenia is 293,309 AMD. But that figure is the only one the official statistics publish — and it does not reflect what a typical Armenian worker actually earns. To uncover the true picture, we applied statistical tools to the Armstat grouped data to calculate the median and mode. The gap between these three numbers reveals a striking contrast: essentially two different economies within one country.
💰 tvyal.com/wages — find your salary percentile by sector → 📊 tvyal.com/wages/trends — explore wage trends since 2018 →
Three numbers, a lesson in economic realities
- The overall average (arithmetic mean) — 293,309 AMD: This is the number in official press releases. It is pulled upward by a thin layer of high earners in finance, IT, and mining, and does not represent what most workers take home.
- The middle person’s pay (median) — 219,736 AMD: If you want to understand what a typical Armenian worker earns, this is the right number. It is the wage at which exactly half of all formal workers earn more and half earn less — a full third lower than the official average.
- The most common pay (mode) — 123,326 AMD: Perhaps the most striking figure. This is the single most common wage contract in the entire system: barely 42% of the overall average, and below the threshold where the full income tax rate even applies.
This three-way gap is not a statistical accident. It is the signature of a highly polarized, right-skewed economy where a small, high-earning sector inflates the overall picture while the vast majority of workers sit well below the “average.”
The widening gap
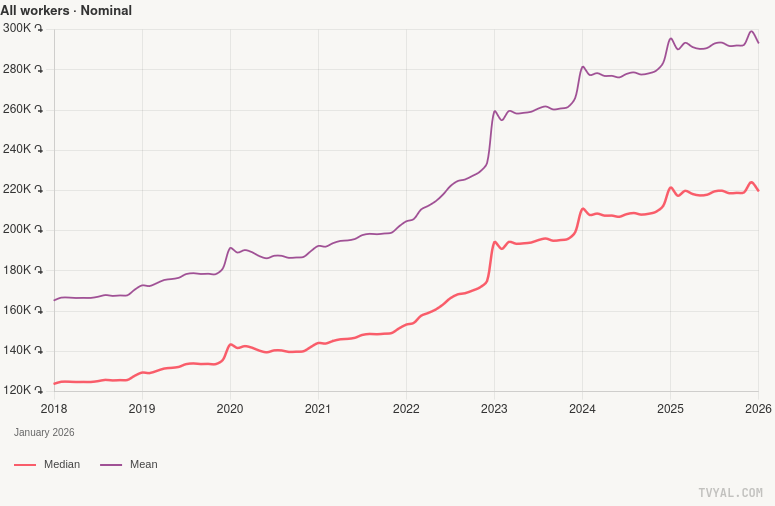
The chart above shows nominal overall average and middle-person’s-pay wages for Armenia’s formal sector since January 2018. Both lines have grown, but they are growing apart.
In early 2018, the overall average was roughly 35,000 AMD higher than the middle person’s pay. By January 2026, that gap has more than doubled, expanding to around 73,500 AMD. This divergence accelerated sharply from 2022 onward, driven by the influx of capital and high-earning workers following the Russian sanctions shock. The arithmetic mean absorbed this influx; the median — the reality of the typical local worker — moved much more slowly.
(The interactive page also offers a real, CPI-adjusted view of this data. While the middle person’s nominal pay has nearly doubled since 2018, when inflation is factored in, the gains in real purchasing power are substantially smaller and heavily concentrated at the top.)
Who is actually in the formal data?
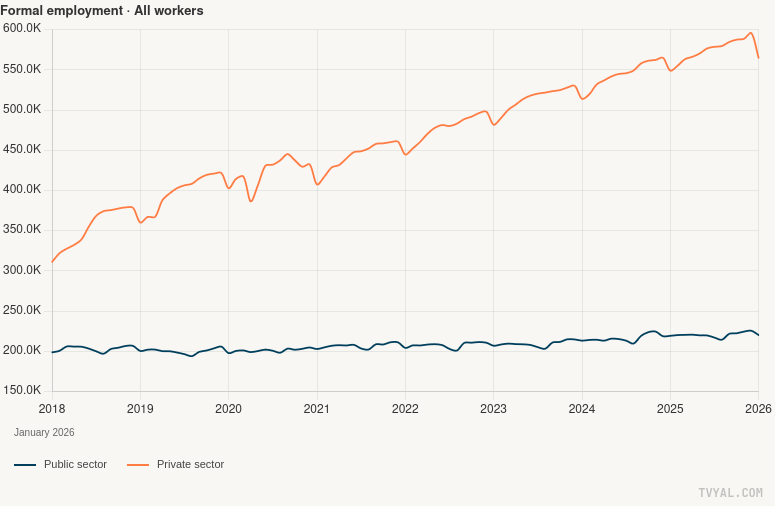
All of the above covers only the formal sector: roughly 700,000+ workers with registered employment contracts.
The employment chart reveals a massive structural shift. Private-sector formal employment has grown dramatically since 2018, surging from around 310,000 to nearly 580,000 jobs. Meanwhile, public-sector employment has remained stagnant at around 200,000. The formal sector is expanding — but almost entirely through private employment, which, as we have shown in previous analyses, is heavily concentrated in Yerevan.
The deep sectoral divide
The percentile calculator on /wages allows you to filter by NACE sector. The pattern is painfully consistent. Finance, IT, and mining dominate the top of every percentile. Workers in agriculture, education, and accommodation sit near the bottom, frequently earning below the national middle person’s pay of 219,736 AMD.
A rural schoolteacher and a Yerevan-based bank analyst are both bundled into the same official “average” — which is precisely why that average describes neither of their realities.
The single most important indicator to watch: the gap between the overall average and the middle person’s pay. When it widens, the economy is becoming more polarized. When it narrows, growth is finally reaching the broader population. At 73,500 AMD (33% of the mean), the current gap is the widest we have ever seen in the data series.
See also our related analyses:
* Wage distribution and employment data from Armstat (Statistical Committee of Armenia), January 2018 to January 2026. CPI data from the Central Bank of Armenia. Calculations and chart code available on GitHub.