Exports Growth, Shrinking Fields: The Decline of Armenia's Agriculture
Armenia’s agricultural exports nearly doubled between 2018 and 2024, reaching $1.27 billion. Agriculture’s share of GDP fell from 13.7% to 7.9% over the same period. Both numbers are official, from the same statistical agencies, measuring the same economy. They appear to contradict each other. They don’t, but the explanation reveals a structural shift that the headline export figure conceals.
Two diverging curves
Put the two series side by side and the contradiction resolves into a pattern.
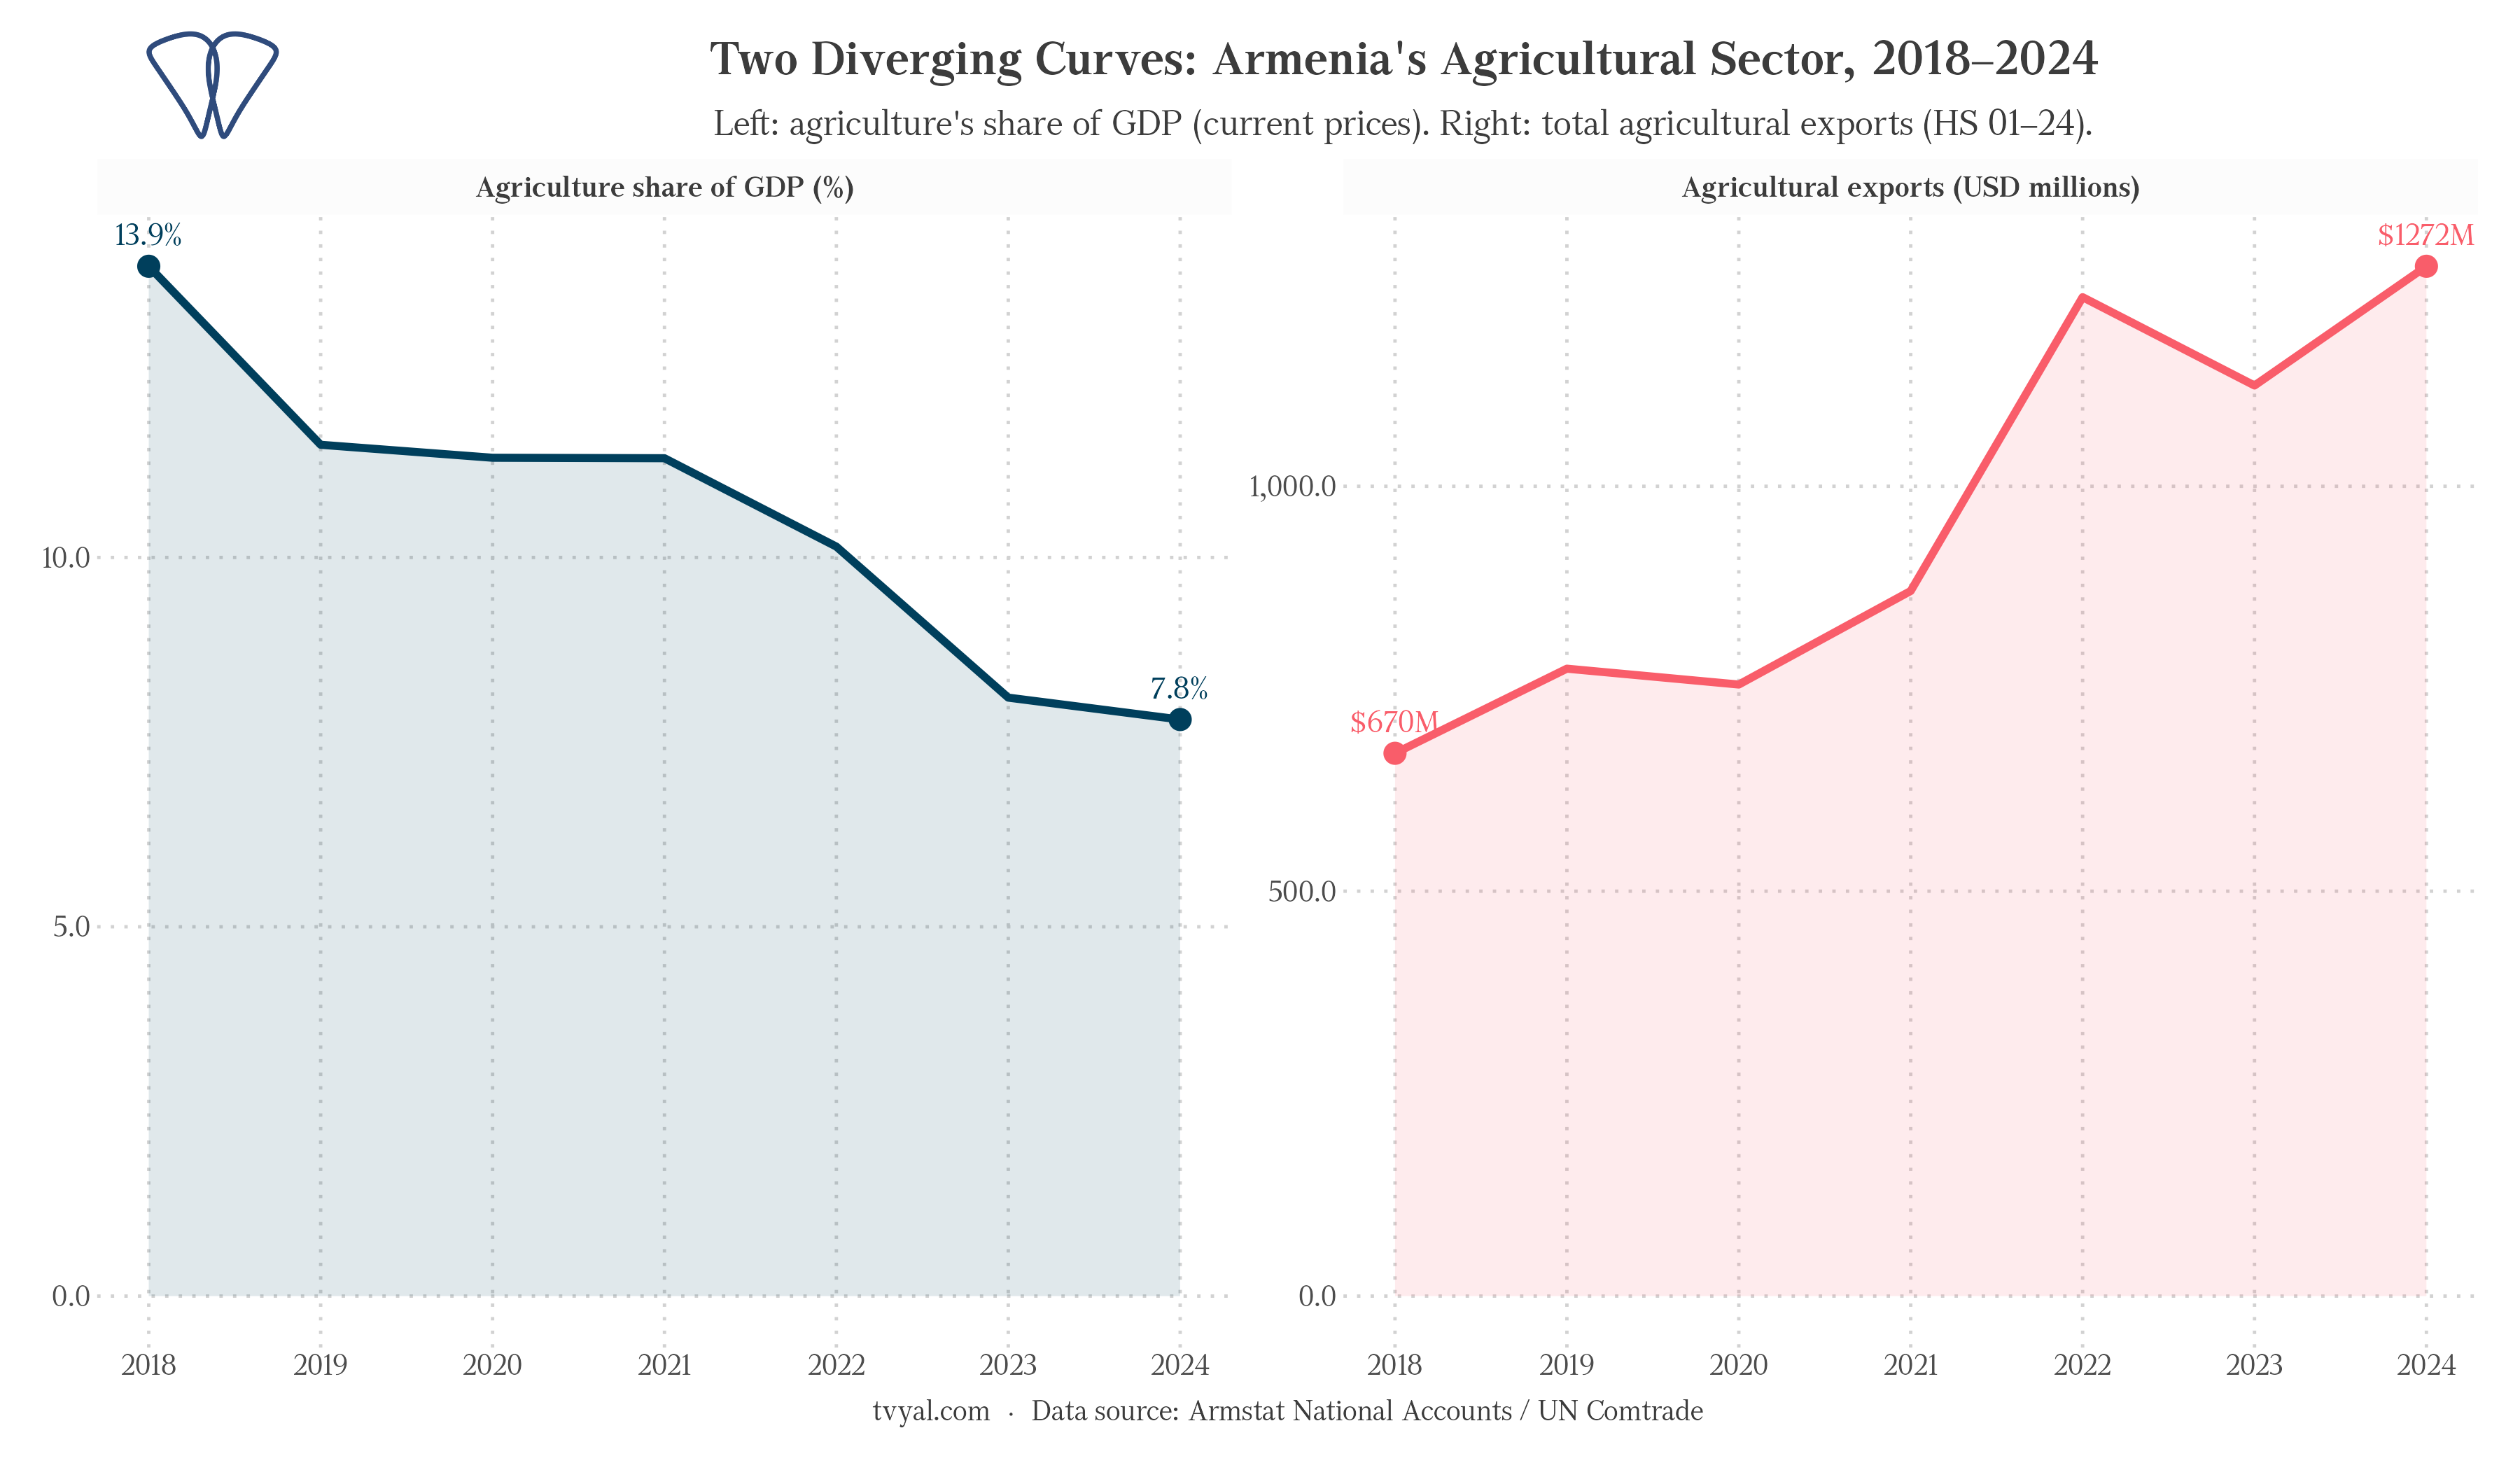
The GDP share tracks what the sector actually produces: value added by Armenian farms and food processors as a fraction of the whole economy. It fell steadily from 13.7% in 2018 to 7.9% in 2024. The export figure tracks what crosses the border under HS chapters 01–24, regardless of where the underlying value was created. It nearly doubled.
When a sector’s exports rise while its GDP share falls, one explanation dominates: the exports increasingly reflect trade intermediation and raw-material processing rather than domestic production. The export figures are not false. They are measuring something different from what the headline implies.
The only sector that shrank
The GDP share decline is not just a relative story. In absolute real-volume terms, agricultural output contracted 13.3% since 2018, making it the only ISIC section in the entire Armenian economy to record negative cumulative growth over this period.
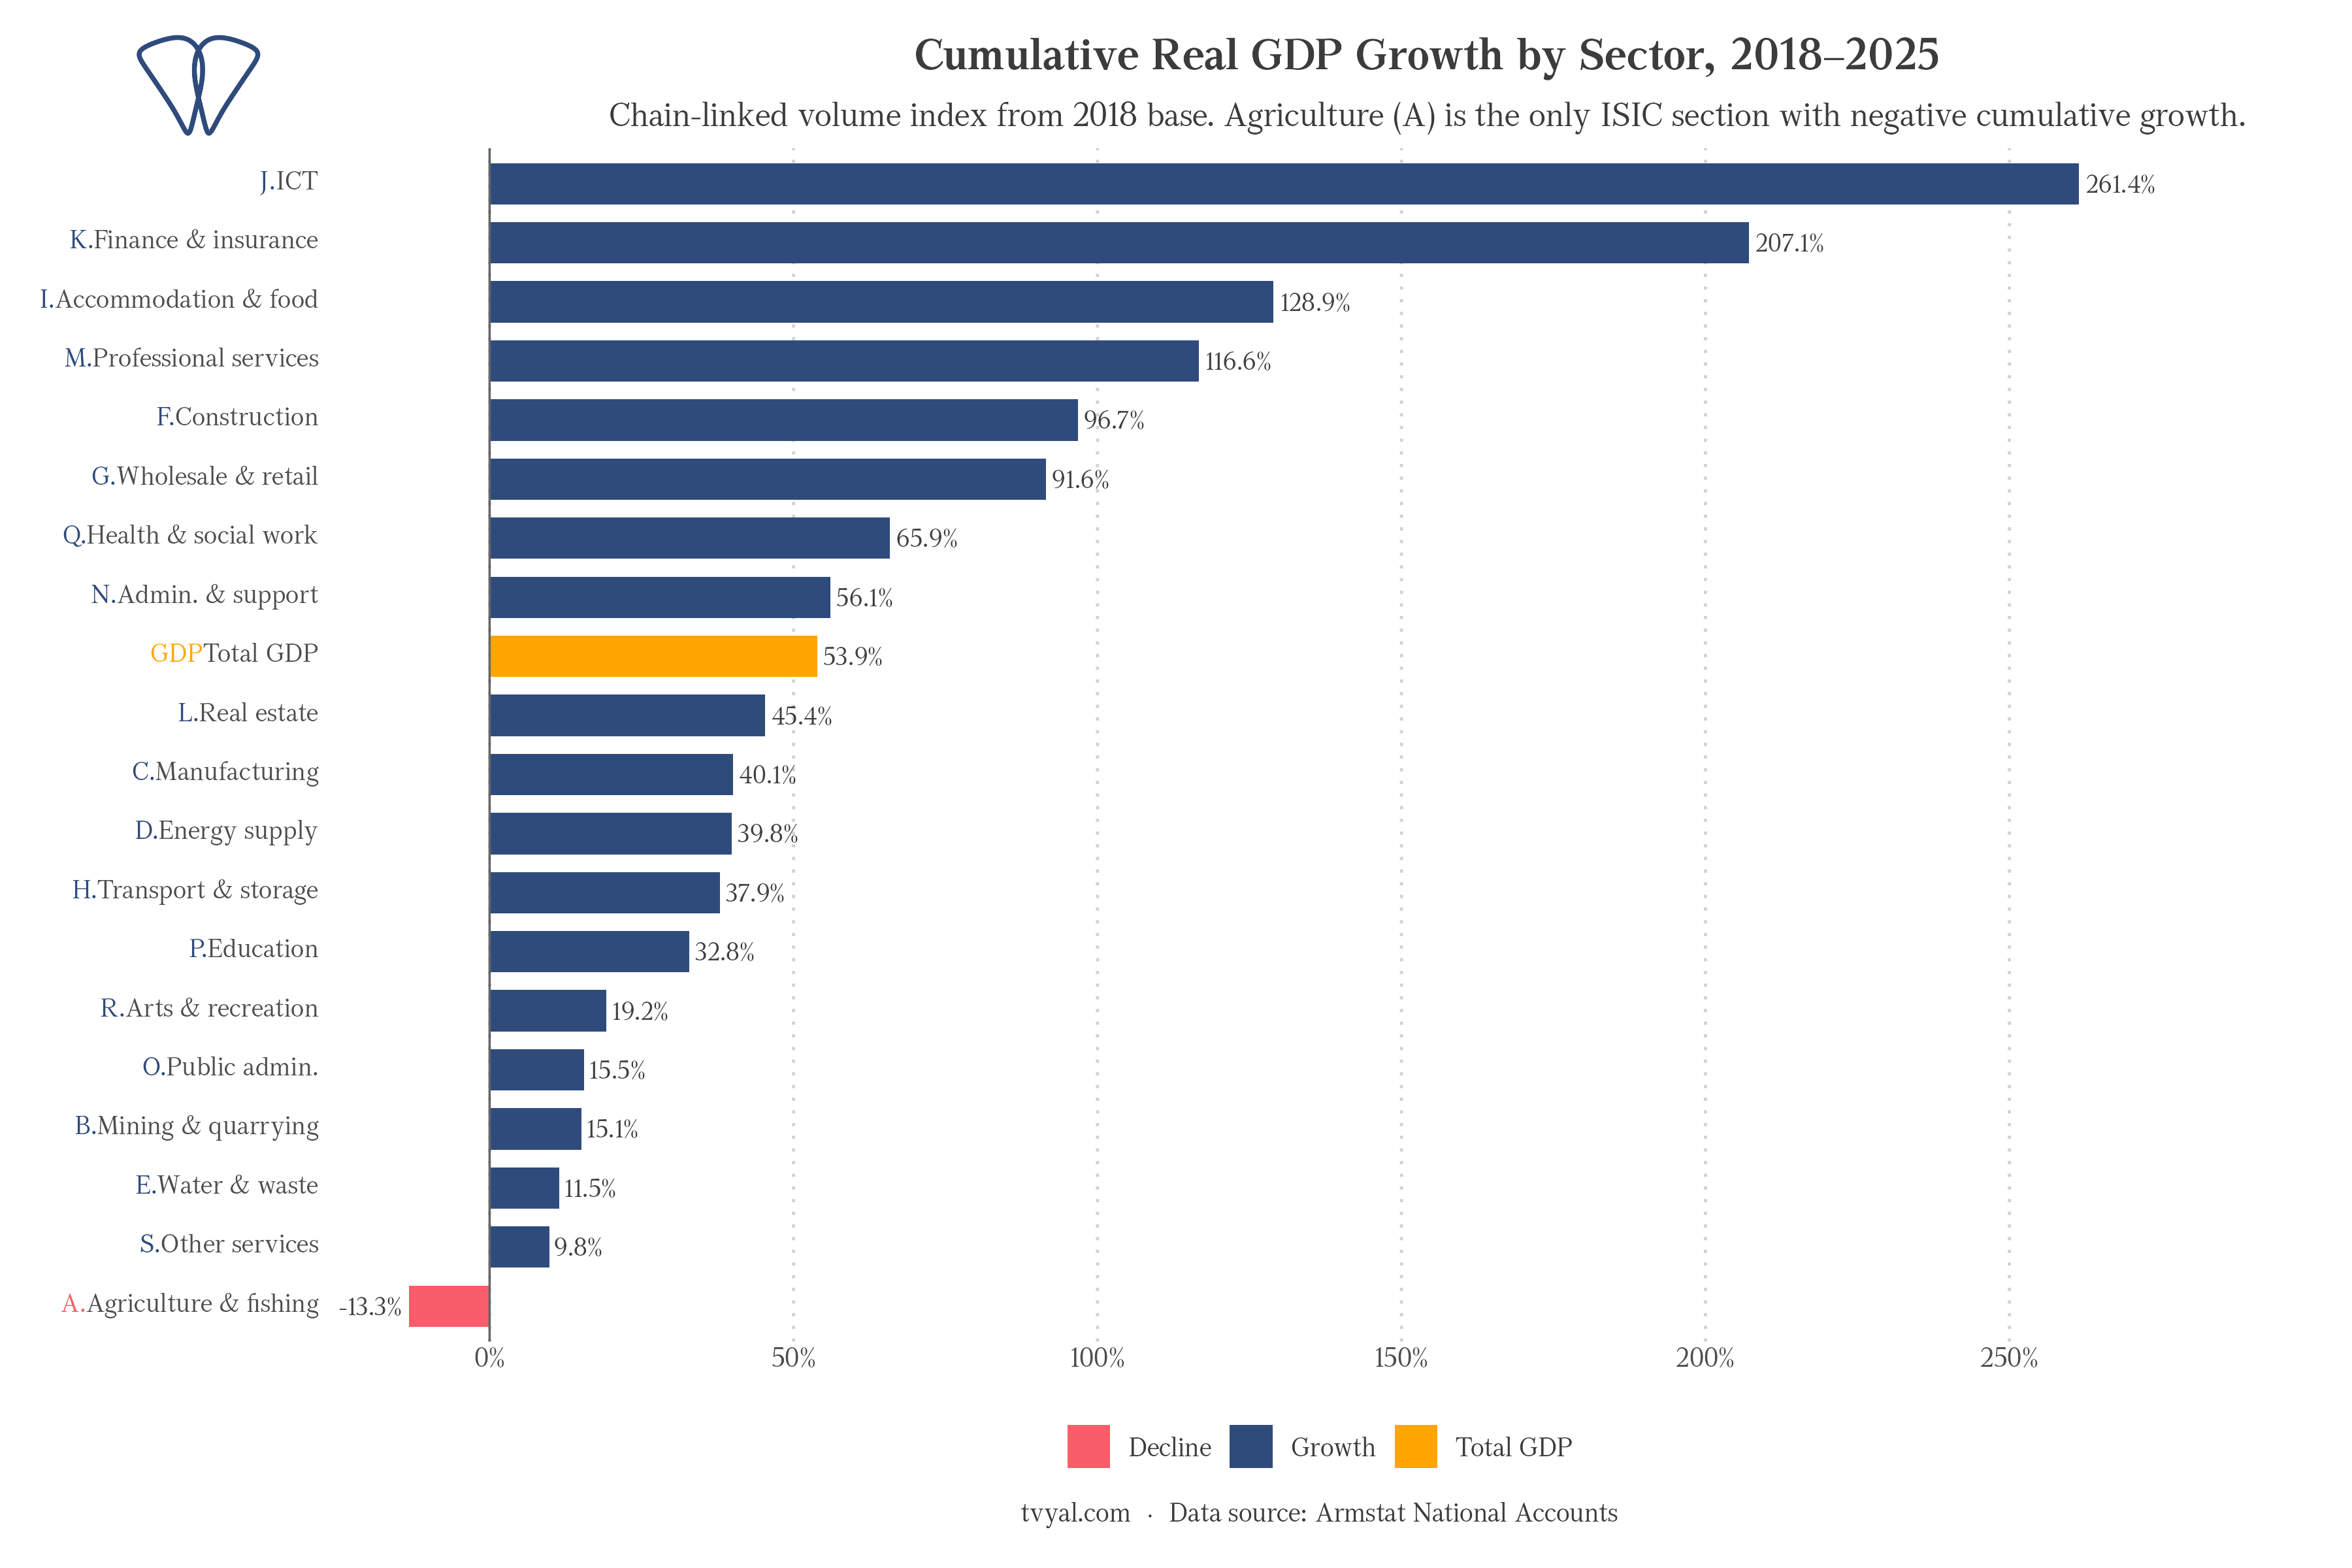
Armenia’s economy grew 53.9% in real terms between 2018 and 2025. Information and communication (J) expanded 264%. Finance and insurance (K) grew 207%. Accommodation and food services, professional services, and construction all recorded strong positive growth. These are largely Yerevan-centric sectors, driven by IT migration, capital inflows, and the post-2022 Russia-sanctions windfall.
Agriculture went the other way. A 13.3% real contraction inside an economy that nearly doubled means the sector lost ground every year. The gap between Yerevan’s service economy and the farm economy kept widening.
What the export figure actually measures
The $1.27 billion agricultural export figure is real; goods did cross the border. The question is what generated that value.
Chapter 24 (tobacco and manufactured cigarettes) accounts for roughly a third of all agricultural exports in 2024. Yet domestic tobacco cultivation contracted by approximately 40% over the same period. The cigarettes were produced from imported raw materials, processed in Armenia, and re-exported. The trade flow is genuine. The value accruing to Armenian agriculture is minimal.
Sugar refining output grew 78% in 2024, the single largest increase across all food manufacturing categories. Armenia has no meaningful sugar beet sector. The expansion reflects processing capacity working with imported sugar intermediates: a manufacturing margin, not an agricultural recovery.
Strip out re-export and raw-material-processing categories, and the growth in domestically generated agricultural export value is far smaller than the headline suggests.
The processing sector in retreat
Food manufacturing statistics show what a production decline looks like from the downstream side.
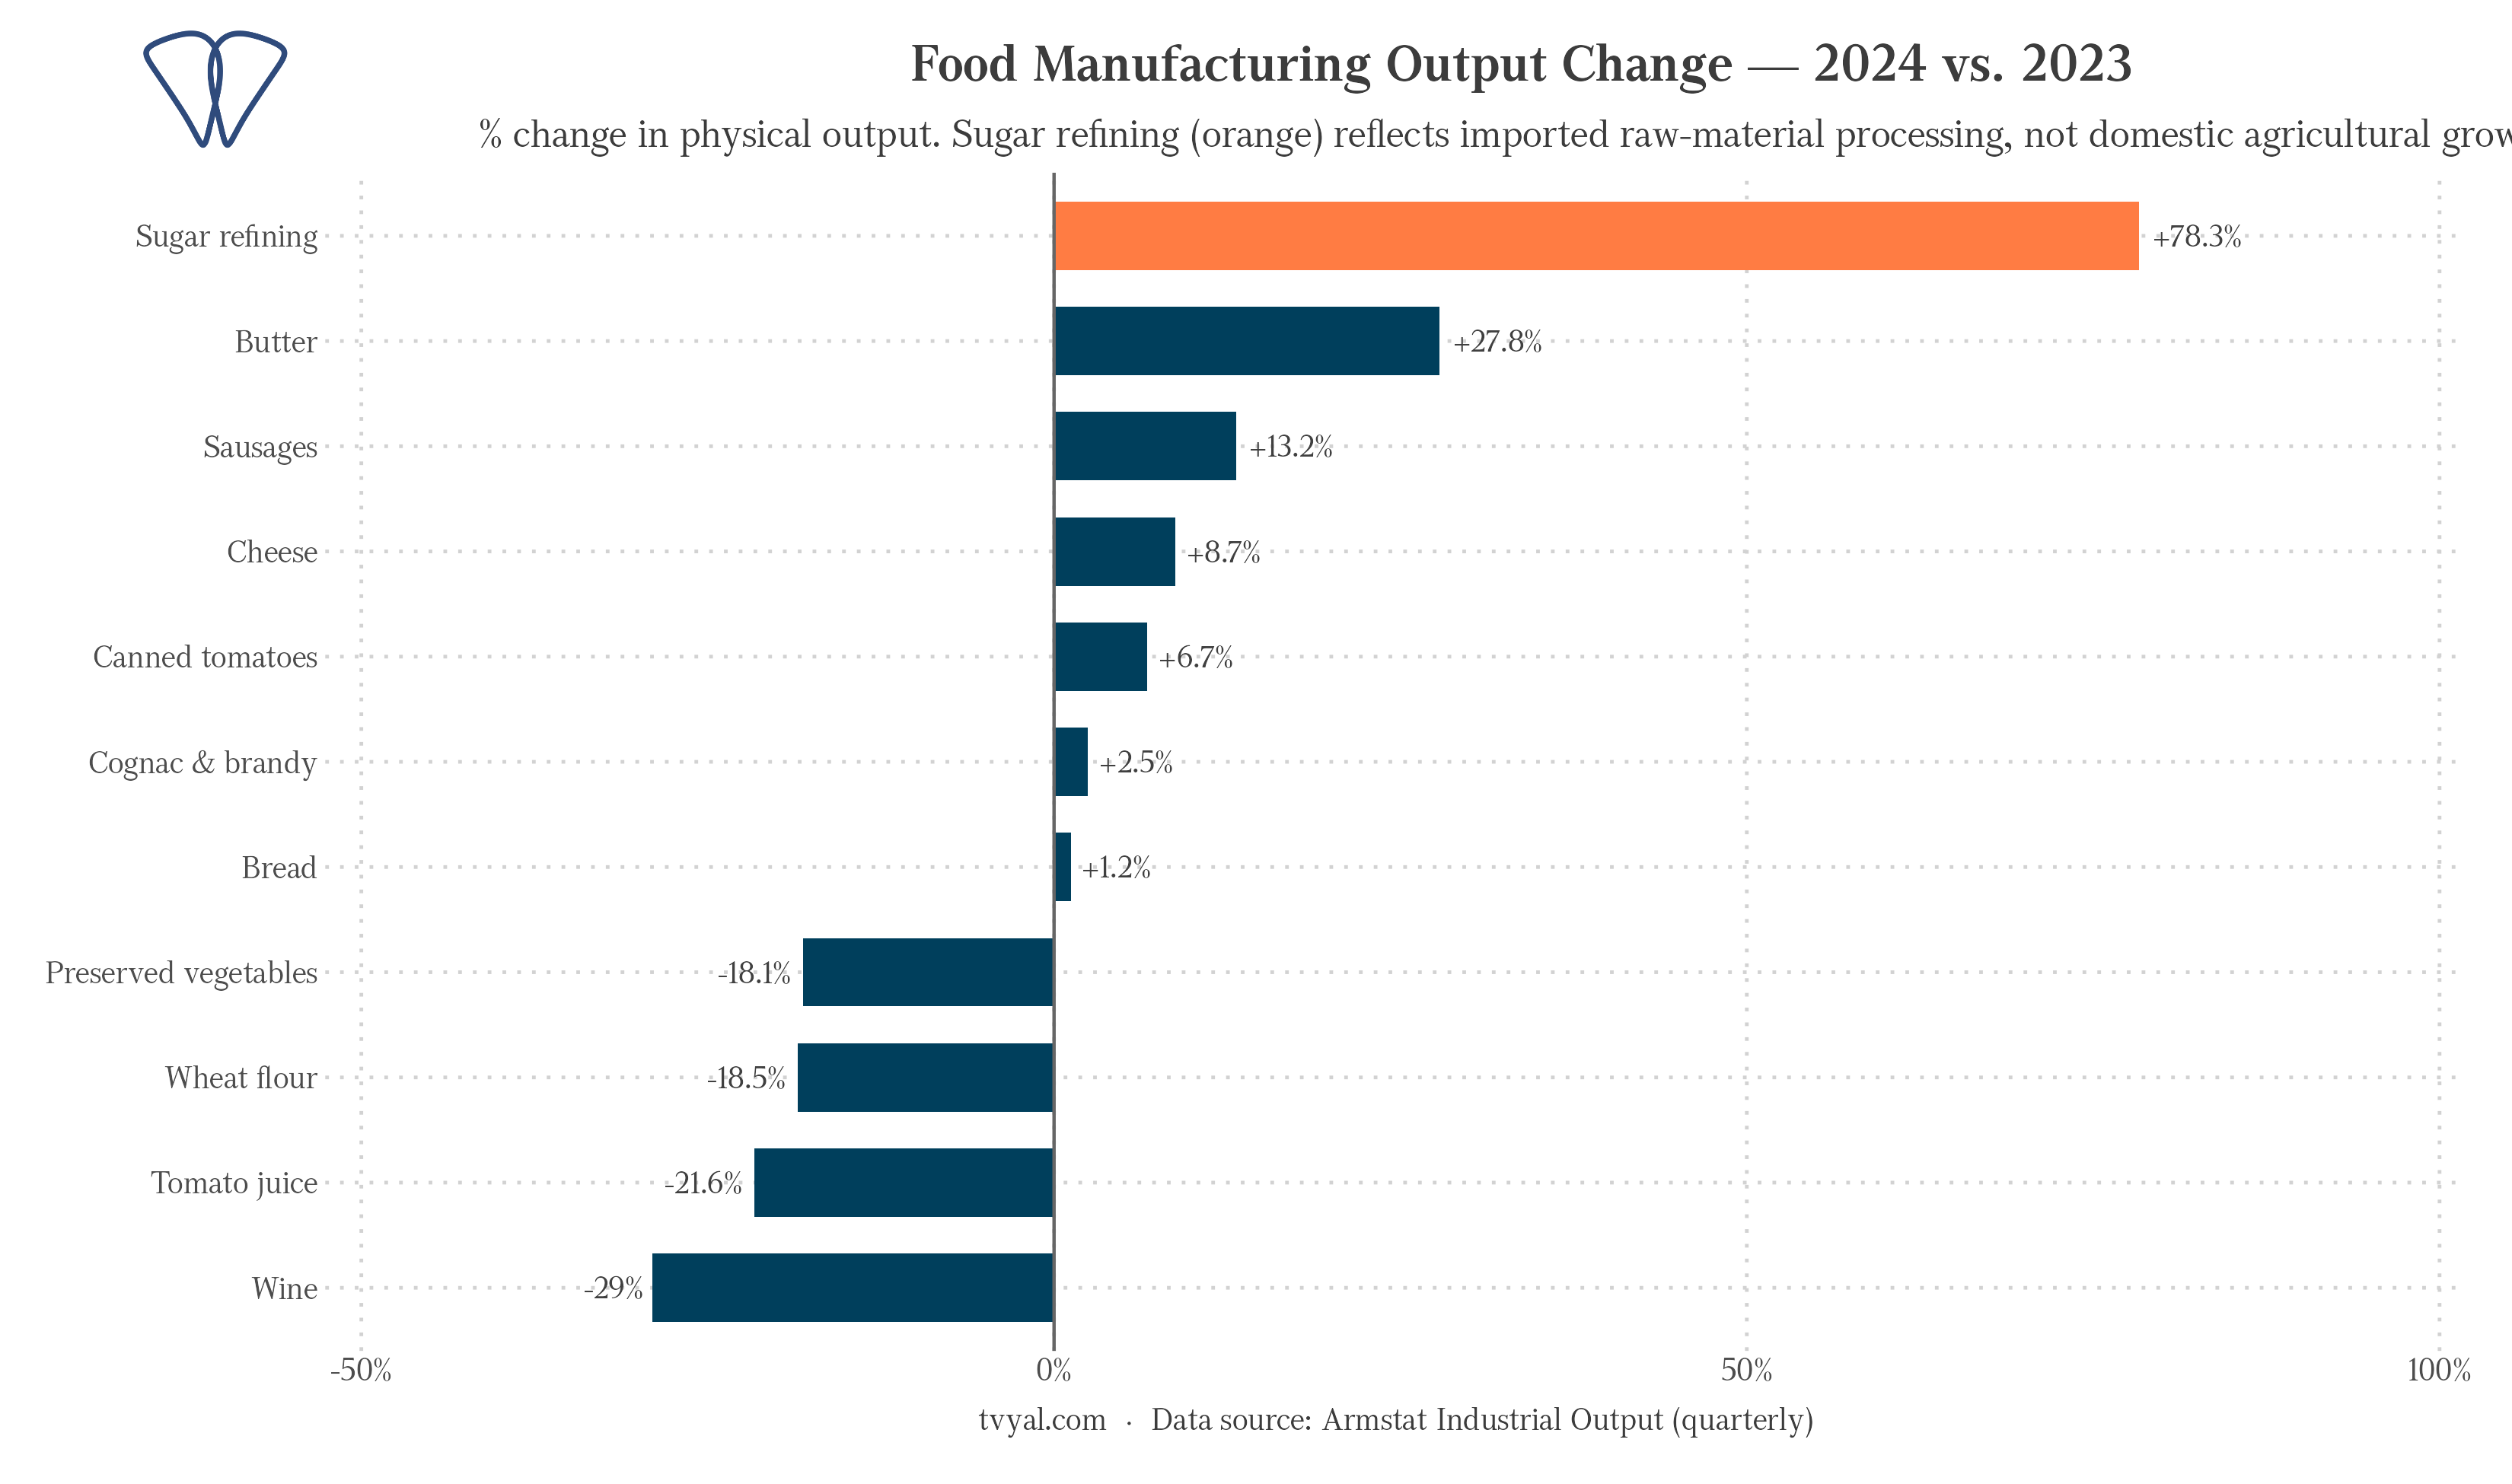
Preserved and canned vegetables output fell 18% in 2024, and tomato juice dropped 21% for the full year before accelerating to a 37% decline in the first half of 2025. Wine fell 29%. Wheat flour fell 18.5%. These facilities are not failing on their own; they are running below capacity because local raw material supply has contracted.
The sugar refining anomaly is the confirmation: when cheap imported intermediates are available, processors substitute. The substitution is rational at the firm level and corrosive at the sector level.
The product-level picture
The table below covers 15 critical food product categories in 2024. Across dairy, vegetables, and beverages the pattern holds: more imports, smaller local share, processors with less to process.
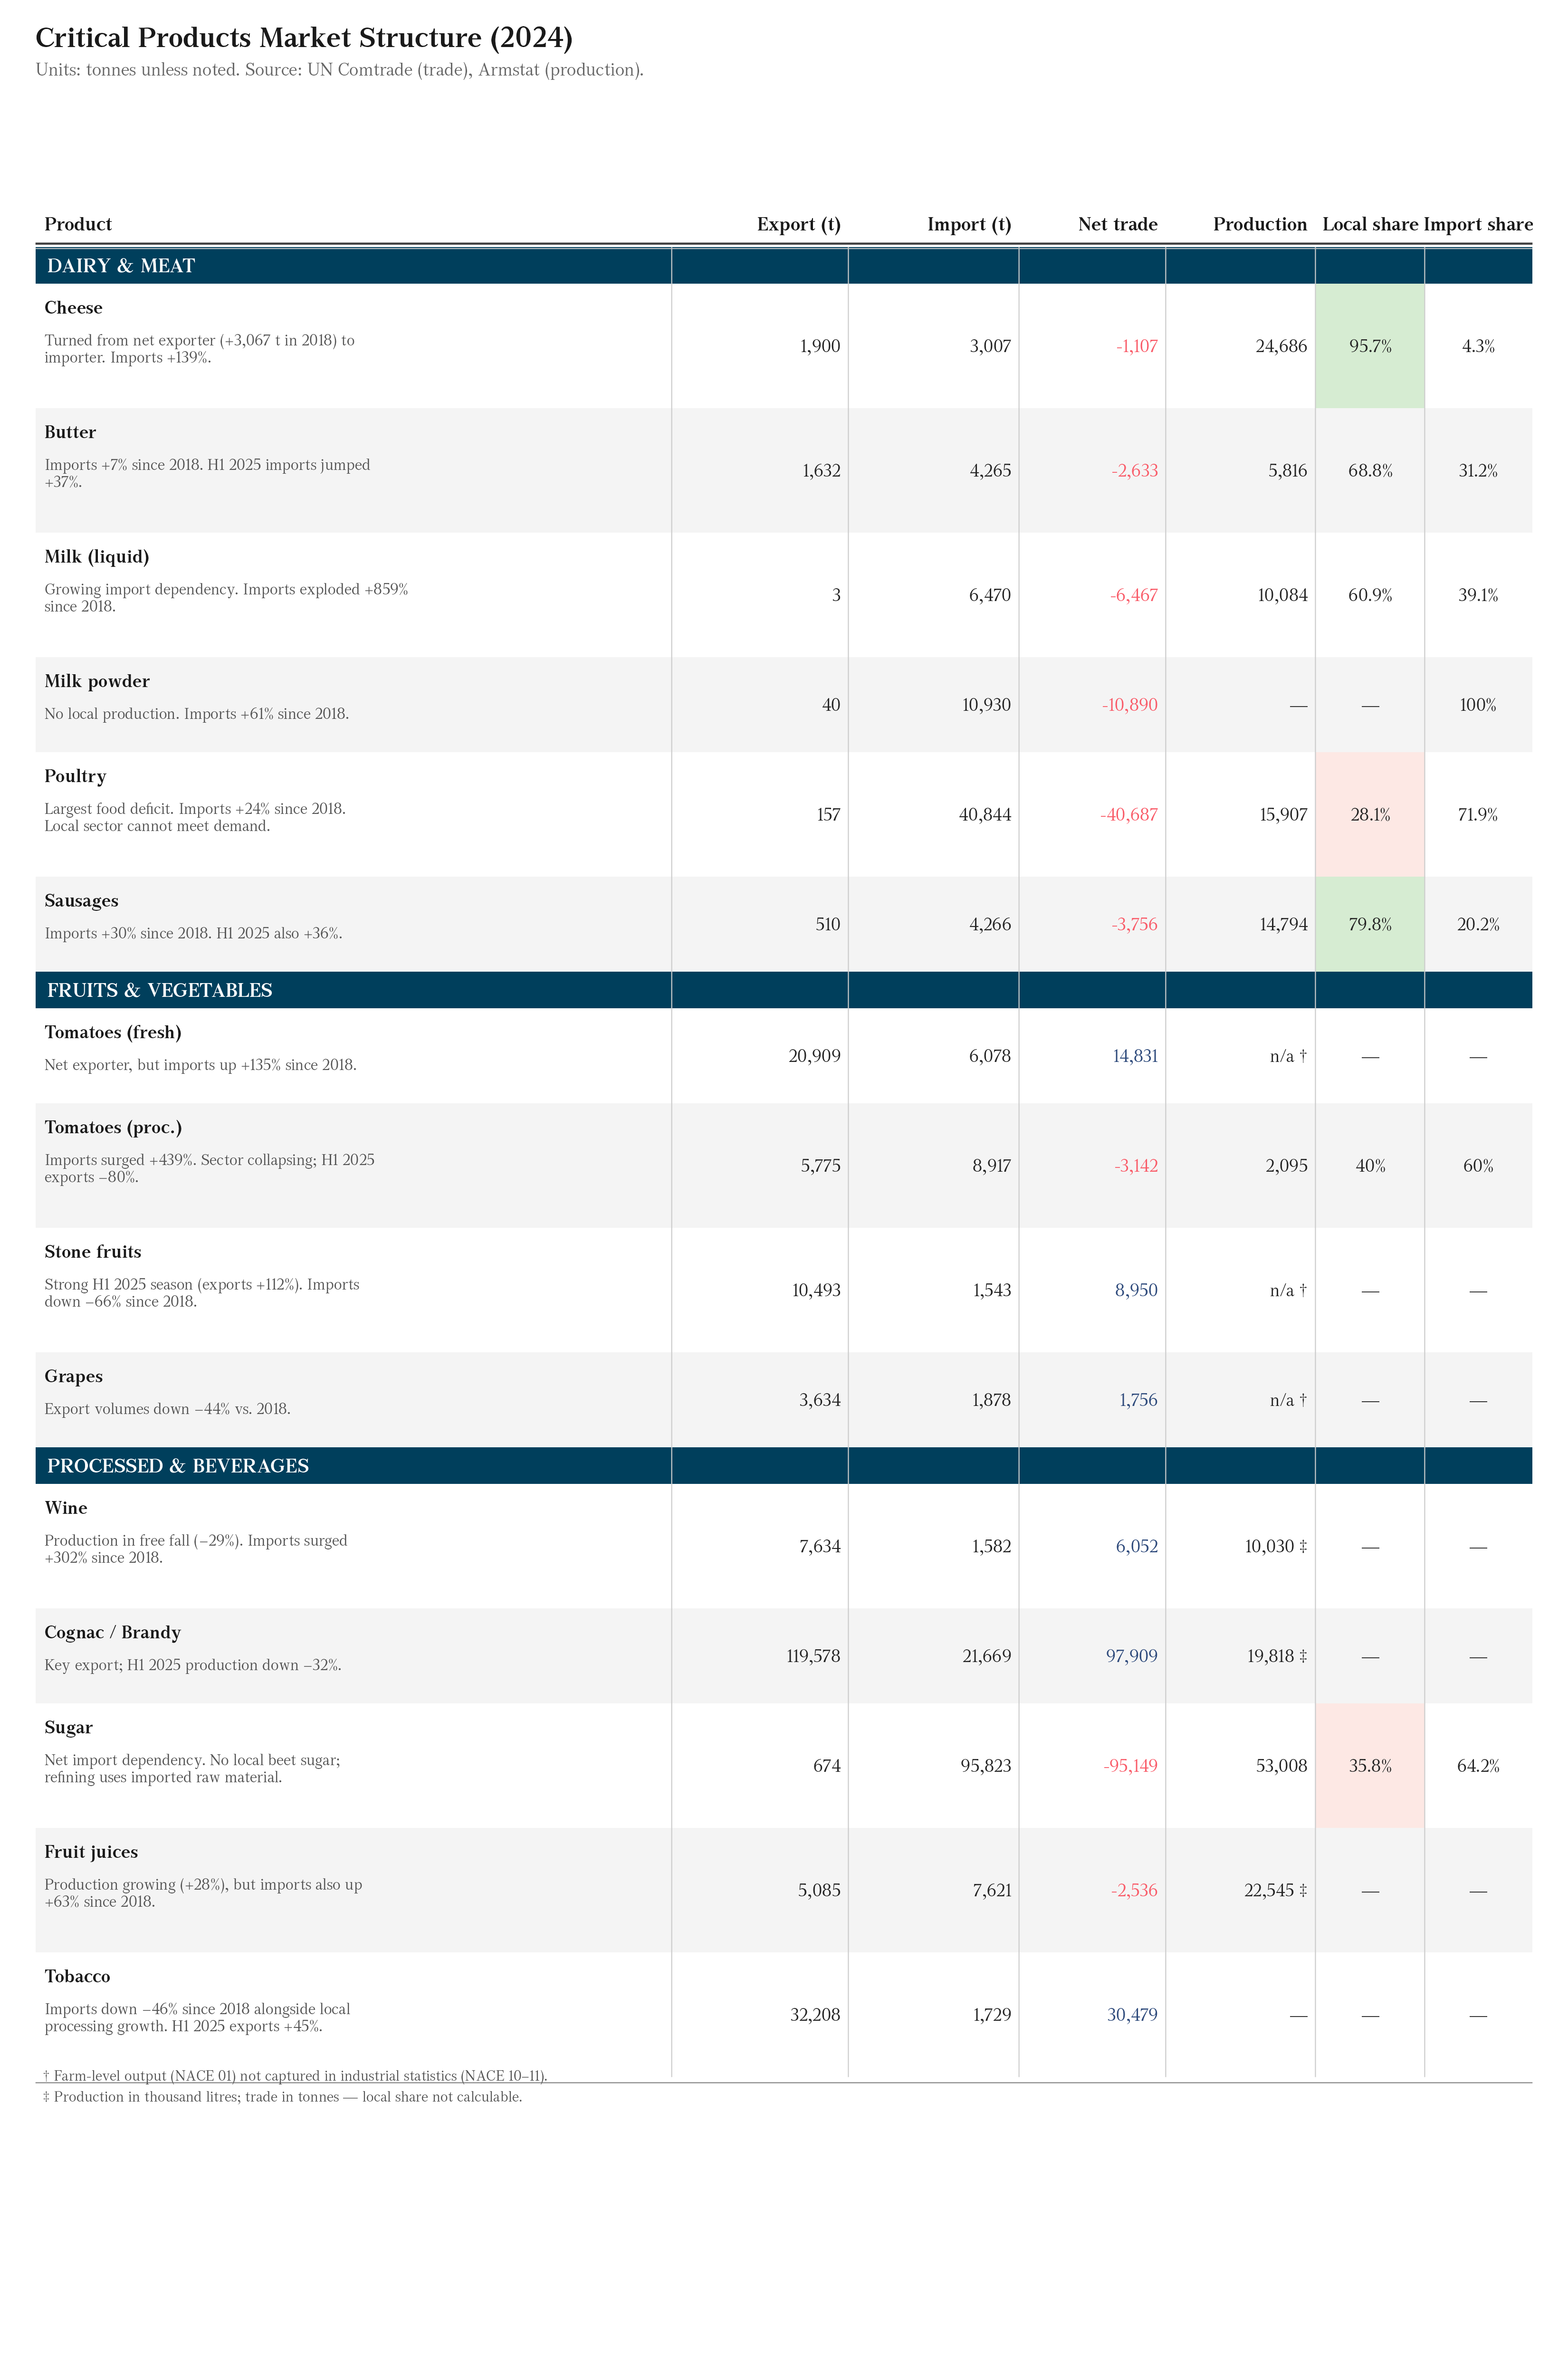
Poultry has the largest absolute food deficit: 40,844 tonnes imported against 157 tonnes exported. Local producers supply only 28% of apparent domestic consumption. Imports have risen 24% since 2018 and the gap has not closed.
Fresh milk imports exploded 859% since 2018. In 2018 this was a domestically supplied category. By 2024, 39% of apparent consumption came from imports, and the trend is still moving in one direction.
Processed tomatoes show the starkest reversal: imports up 439% since 2018, and in the first half of 2025 exports from Armenian processors fell 80% year-on-year. The local tomato processing industry is in collapse.
On the export side, tobacco and cognac/brandy dominate. Both are processing-hub categories: raw materials come in, get refined, and leave. Wine is Armenia’s most recognizable agricultural export, but production fell 29% and exports are running on existing stocks.
The compounding pressures
The AMD strengthened significantly in 2022–2024 as capital inflows and remittances drove appreciation. That makes imported food cheaper in Armenian markets and Armenian-produced food more expensive abroad. Local tomatoes cannot compete on price with Turkish or Iranian tomatoes when the dram is substantially stronger than the prior-year baseline [1].
Fertilizer supply runs predominantly through the Verkhny Lars crossing, the single overland route connecting Armenia to Russia via Georgia. Disrupt that corridor and you disrupt the spring planting cycle for the majority of farms dependent on imported nitrogen fertilizers [2].
The institutional side is harder to see but matters. The 2019 merger of the Agriculture Ministry into the Economy Ministry reduced sector-specific monitoring and policy capacity at exactly the moment the sector needed it most. Extension services, disease surveillance, and market-connection infrastructure were consolidated or eliminated.
The indicator to watch: Armstat’s quarterly physical output index for ISIC section A (agriculture, forestry, and fishing). When it records three consecutive quarters of positive real growth, the sector has stabilized. It has not done so since 2021.
Related: Armenia’s Export Geography Since 2018: destination concentration and the EAEU dependency risk.
* Data sourced from UN Comtrade, Armstat National Accounts, and Armstat Industrial Output statistics.
References
[1] JAMnews. Why are imported fruits and vegetables often cheaper than local produce in Armenia? // JAMnews — jam-news.net
[2] Trading Economics. Armenia Imports from Russia of Fertilizers — tradingeconomics.com
[3] Armenian Statistical Committee, National Accounts Database — armstat.am