80% of Armenia's Wages are in Yerevan
In four of Armenia’s ten regions, public sector workers outnumber private sector workers. The wage difference is sharper: 79.7% of the country’s formal wage bill originates in Yerevan, up from 73.5% in 2018. The private sector grew substantially under the current government. Most new jobs were generated in the capital city.
Where the jobs actually are
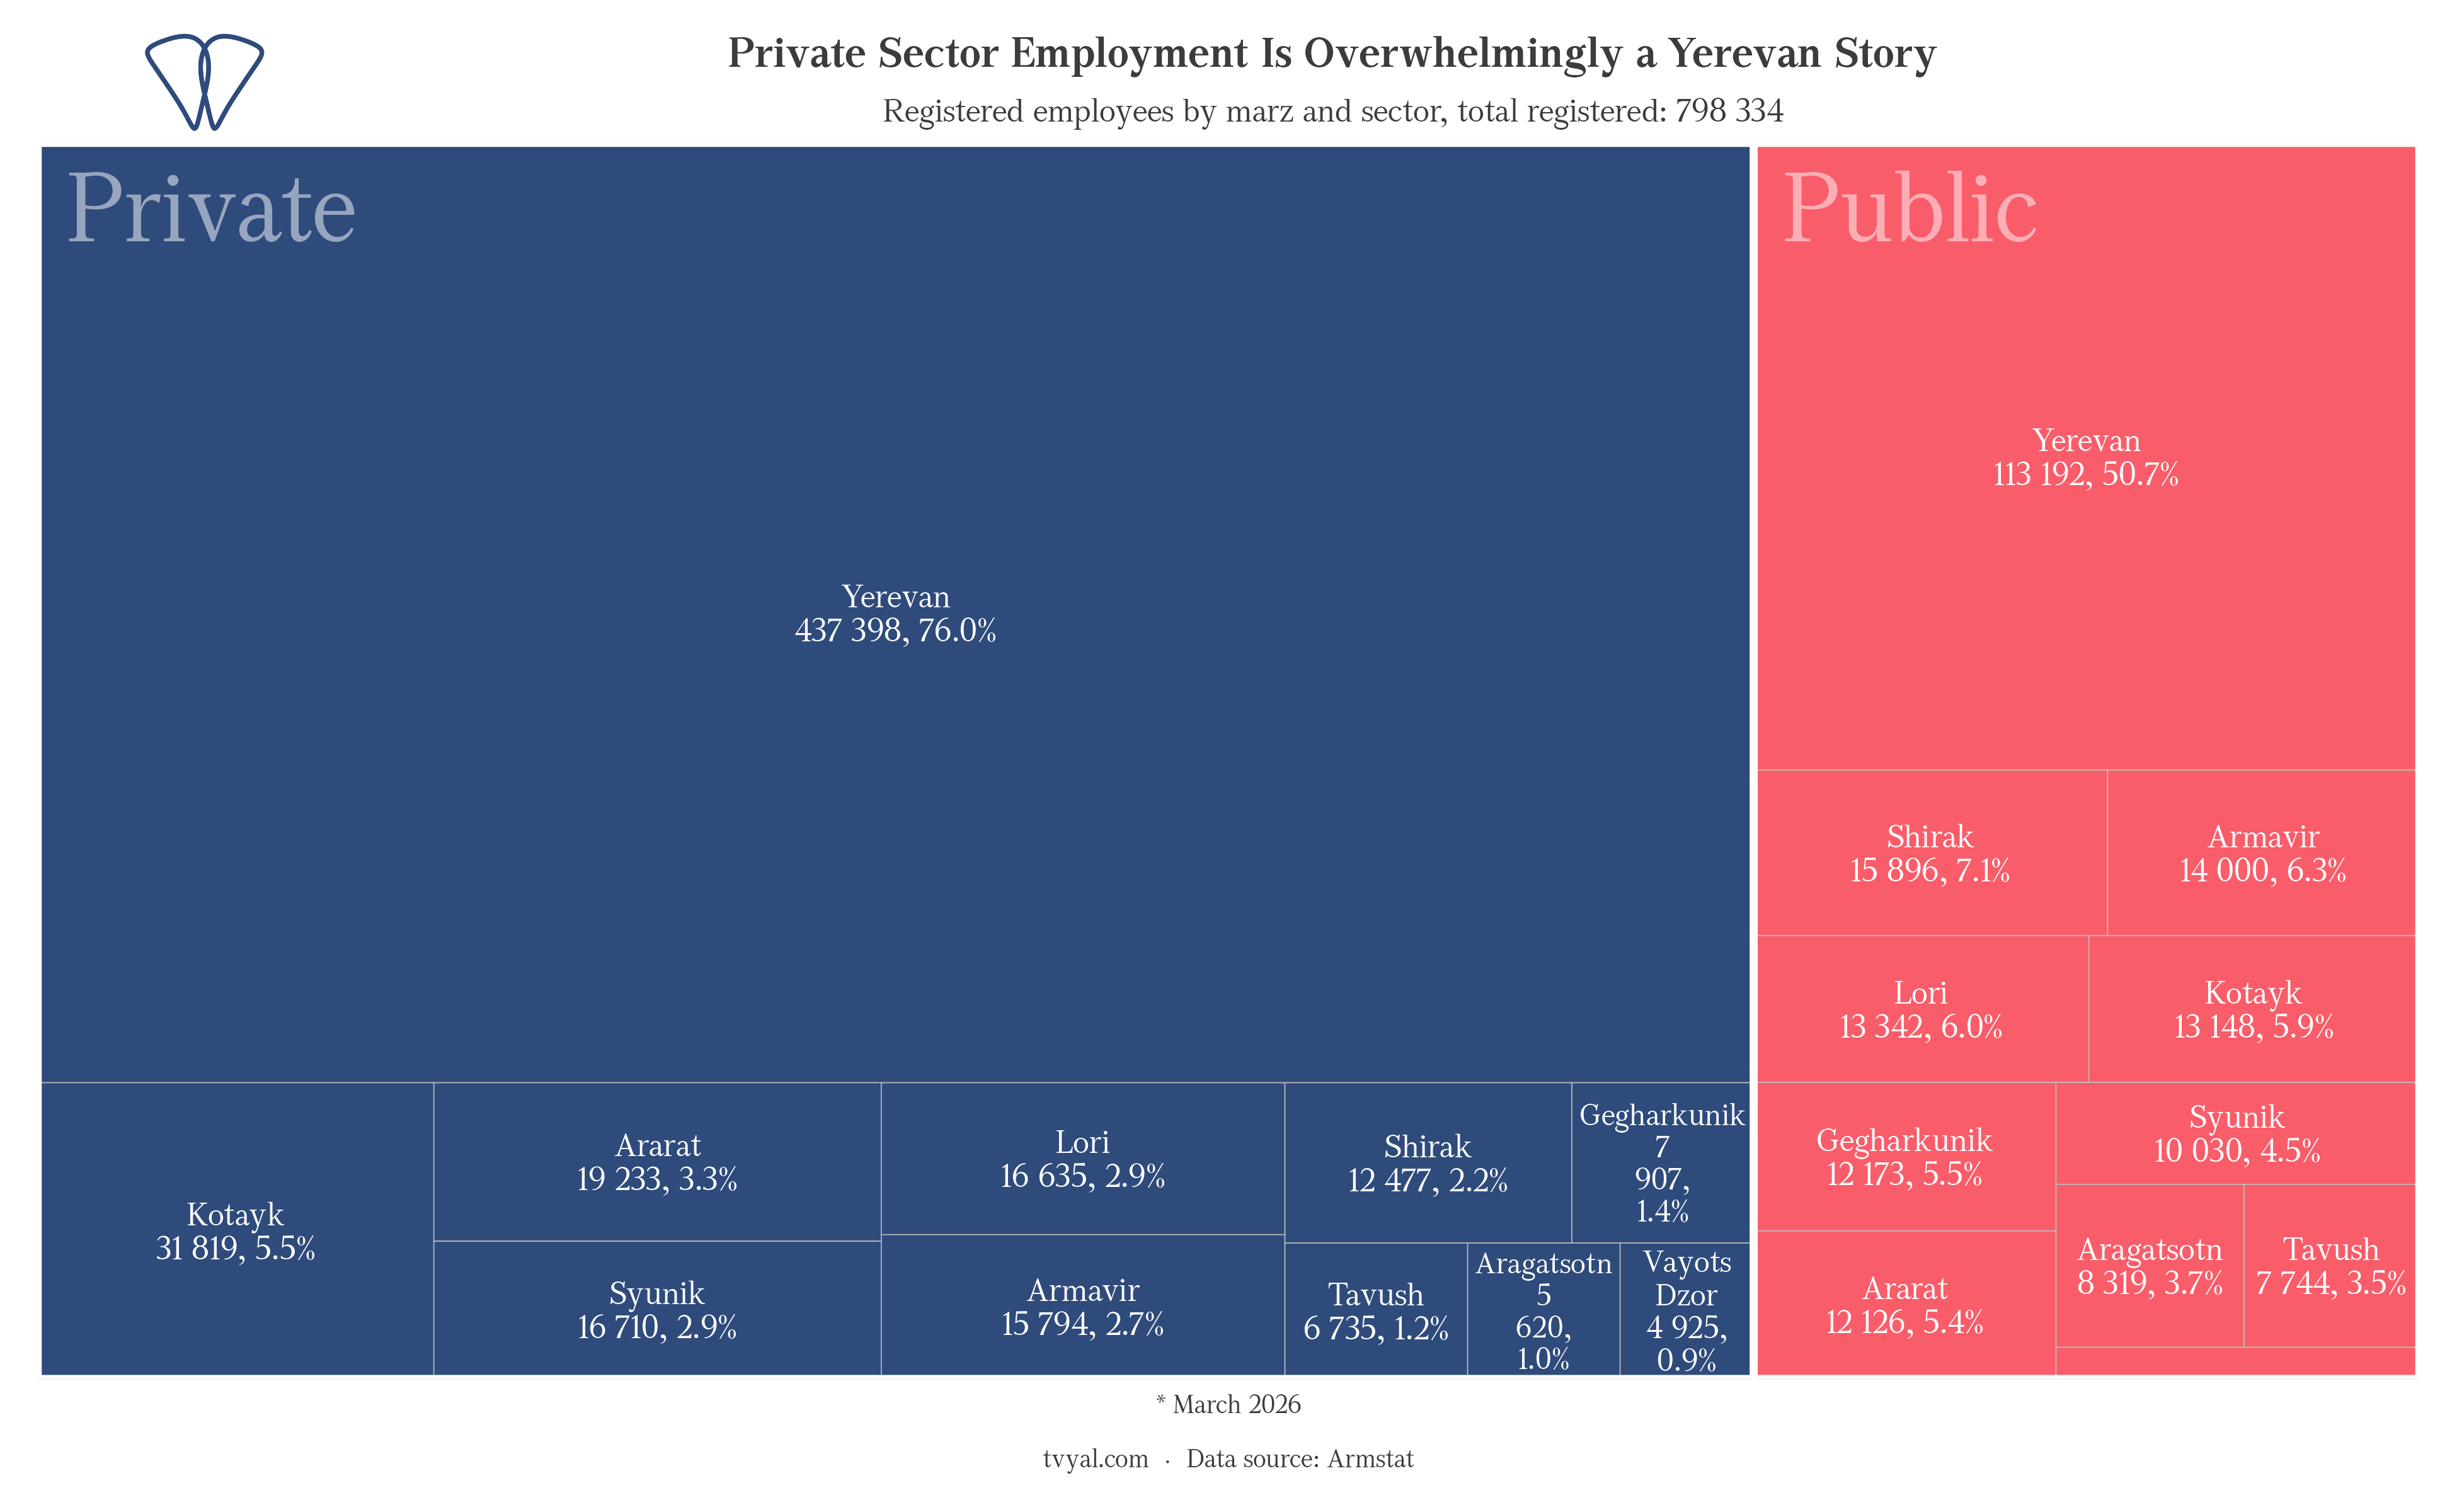
The left block (private sector) is almost entirely Yerevan: 437,000 jobs, 76% of all private formal employment in the country. The right block (public sector) is spread across all eleven administrative units, with Yerevan holding just over half. In the regions the state isn’t competing with a private sector. The regions’ jobs are mostly in the governmental sector.
As of May 2026, Armenia has 798,000 registered formal workers[1]. Roughly 580,000 are in the private sector. About 437,000 of those, 76%, are in Yerevan.
Where the money goes
Jobs are one measure. The wage bill is more revealing.
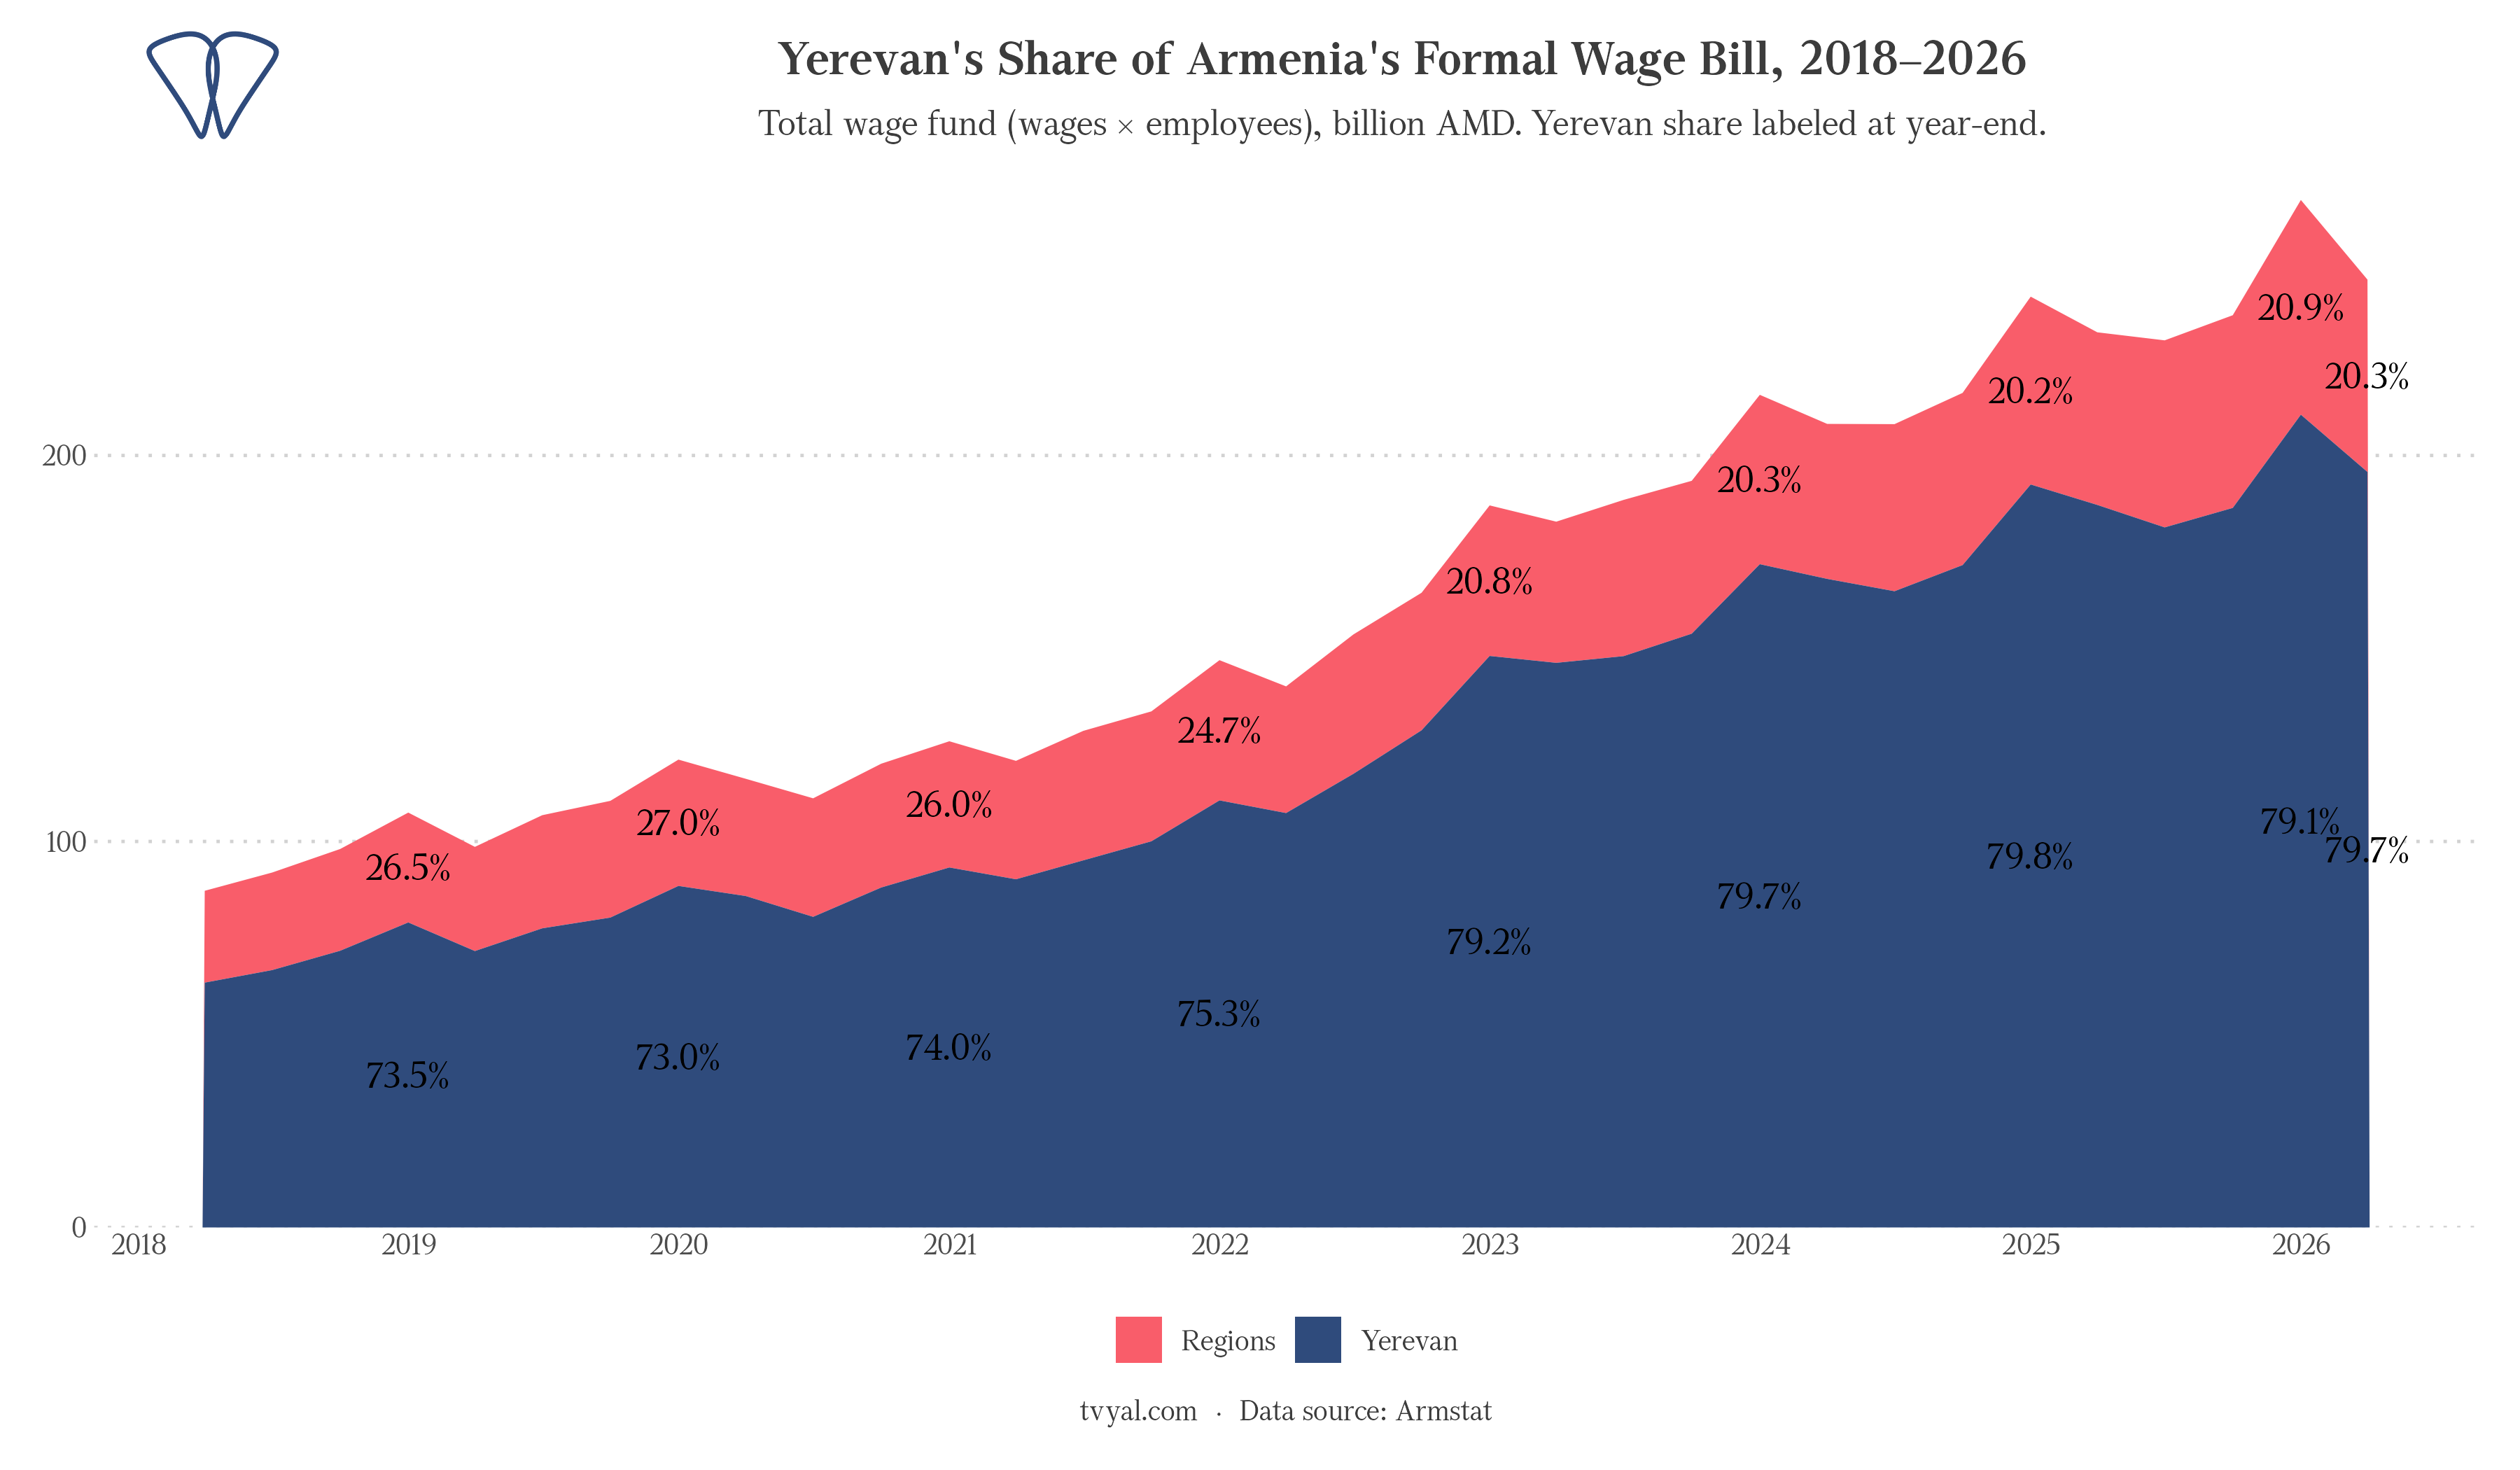
In 2018, Yerevan accounted for 73.5% of the total formal wage fund, already high for a capital city in a country where Yerevan holds roughly 35% of the population. By end-2022 that share had jumped to 79.2%. It has sat at roughly 79-80% since. This means people living outside Yerevan are finding new job opportunities mostly inside Yerevan.
The jump was fast. Between 2020 and 2022, IT employment in Yerevan expanded sharply as Russian and Ukrainian engineers arrived following the war and sanctions shock. Financial sector wages rose in parallel. Both sectors run almost exclusively out of the capital. The 2022-2023 period also brought a surge in remittances and capital inflows, but the growth they amplified went into banking, real estate, and services concentrated in Yerevan — mostly in the center of Yerevan.
The total formal wage bill tripled, from around 380 billion AMD in 2018 to over 1.1 trillion AMD in early 2026. The regions’ share stayed at about 20% throughout. It didn’t move.
How state-dependent each region is
Outside Yerevan, formal private employment is thin. In Gegharkunik, Aragatsotn, Shirak, and Tavush, public jobs are the majority of formal employment. Public employment doesn’t just edge out private there. It’s the larger half.
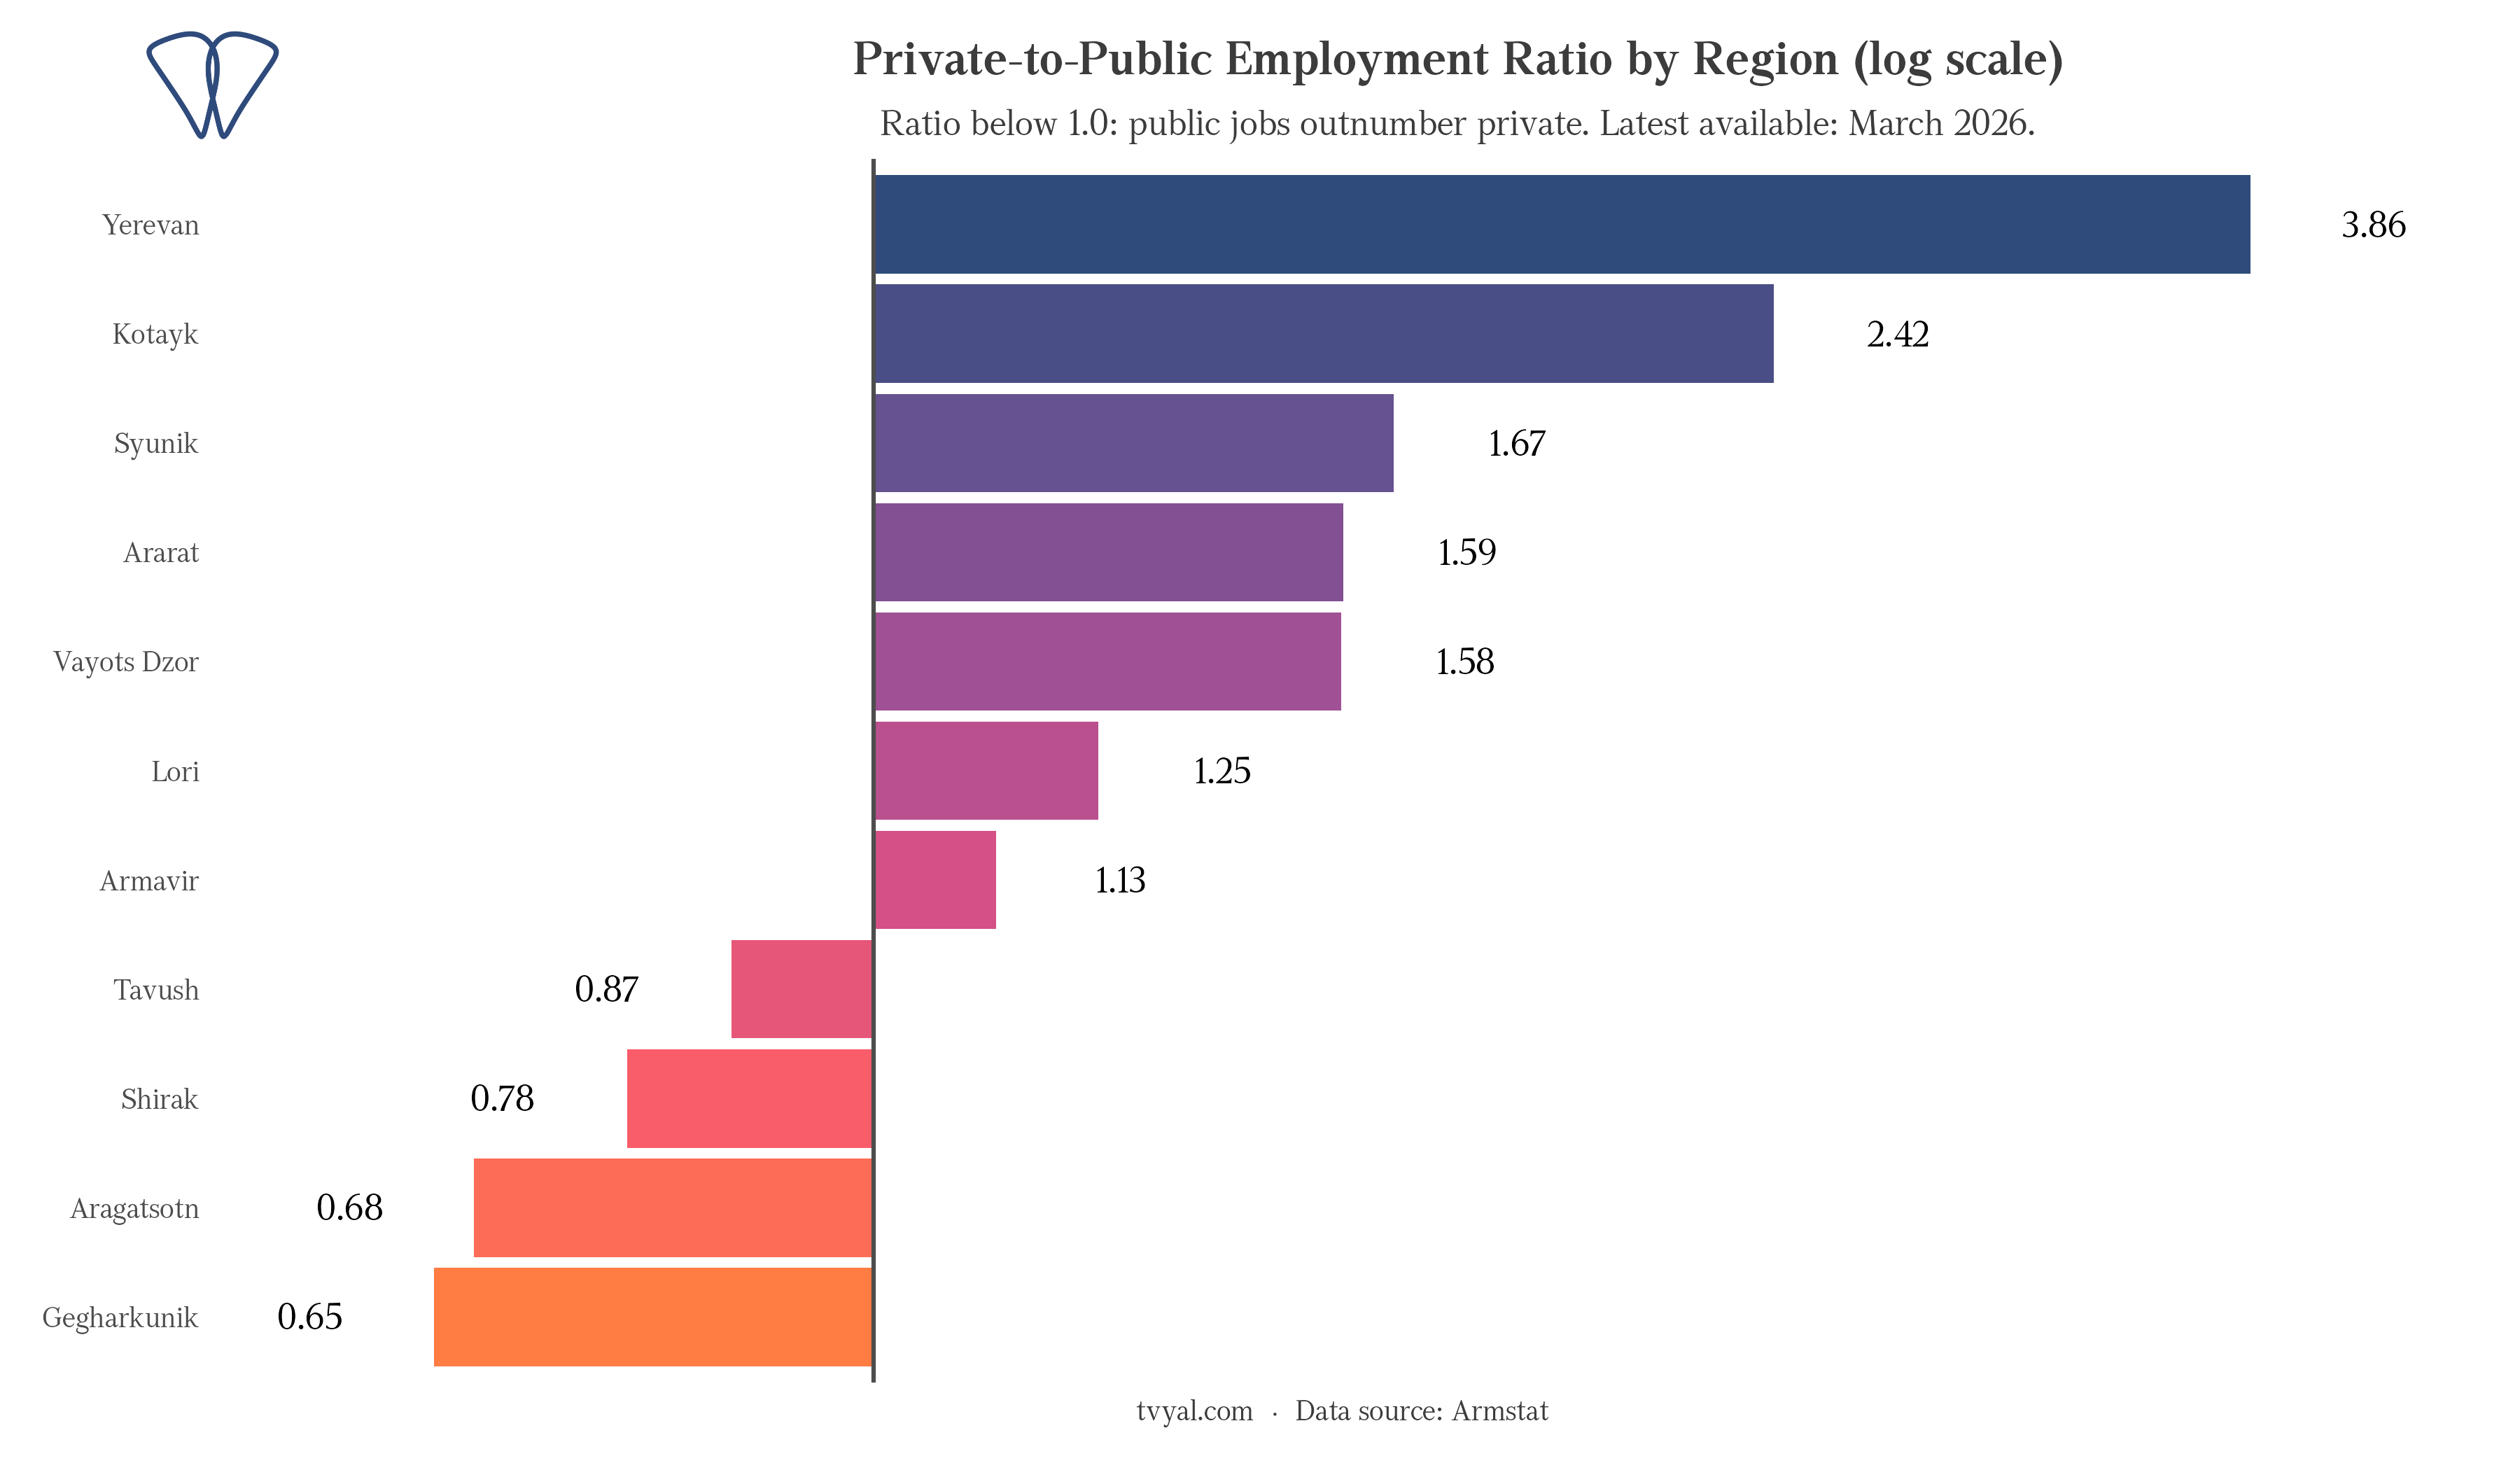
Yerevan has 3.85 private jobs per public one. Kotayk (borders Yerevan, includes Abovyan) comes in at 2.42. Then the numbers drop hard. Gegharkunik is at 0.65, roughly 1.5 public jobs for every private worker. Tavush, Shirak, and Aragatsotn all fall below 1.0.
Gegharkunik is worth pausing on. Large region, Lake Sevan, not obviously remote. Yet its formal private sector is smaller than its public sector. Decades of underinvestment in private enterprise outside the capital will do that, and the recent data doesn’t suggest it’s changing.
Lori and Armavir sit closer to the boundary, at 0.84 and 0.93. A few percentage points of private employment growth would push them across. Where that growth is supposed to come from is the harder question.
The state can manage the state’s cash flows through fiscal and monetary policies. For example, the 2015 income tax return law established that the loan interest rate in construction effectively became 0 percent, which stimulated capital flows entering the economy mainly towards construction and primarily in Yerevan. Tax privileges are also important for international investors; this is a good stimulus from the point of view of managing capital flows entering the country. Thus, tax privileges can be introduced that will stimulate the development of regions, the creation of industrial activity, and an increase in jobs in the regions. For these privileges: in those regions where private jobs are up to 2 times less than public jobs, provide a preferential income tax of 0-10 percent (depending on the type of production), and a profit tax privilege for industrial organizations. This privilege will apply until private jobs in that region are 2 times more than public jobs.
This privilege will not apply in Yerevan and the Kotayk region, where this ratio is already 3.77 and 2.52 respectively. This privilege will apply in Syunik for no more than 1-2 years, as well as in Ararat, where this ratio as of May 2026 is already 1.67 and 1.59 respectively. This privilege will apply for a long time especially in underdeveloped regions: Tavush, Shirak, Aragatsotn, and Gegharkunik regions, where the number of public jobs exceeds private ones. For example, in the Gegharkunik region, registered public jobs are almost 2 times more than private jobs. This initiative will not reduce tax revenues, as almost 80 percent of the wage fund is already formed in Yerevan. It will be a stimulus for enterprises operating in the shadow economy in the regions to come out of the shadow and pay taxes, to create private jobs in the regions, to ensure the balanced development of the regions, as well as to create a stable industrial base for Armenia. This measure will ensure the creation of long-term added value, which will become the basis for the desired 7 percent annual economic growth. This policy can also contribute to the management of internal migration, reducing the number of people moving from the regions to Yerevan and encouraging specialists to work in their native regions. By contributing to the development of the regions, this project can help preserve the cultural and social capital of the regions. The current state of Armenia’s labor market shows a significant imbalance between Yerevan and the regions. This situation requires coordinated and long-term solutions aimed not only at general economic growth but also at the fair distribution of that growth across all areas of the country. The approach regarding the proposed tax privileges can be one of the first steps in this direction, but it must be accompanied by educational, infrastructural, and other social initiatives to ensure the comprehensive development of the regions.
The same pattern, three data sources
The wage data is not an Armstat artifact. Real estate registrations and bank lending point the same direction.
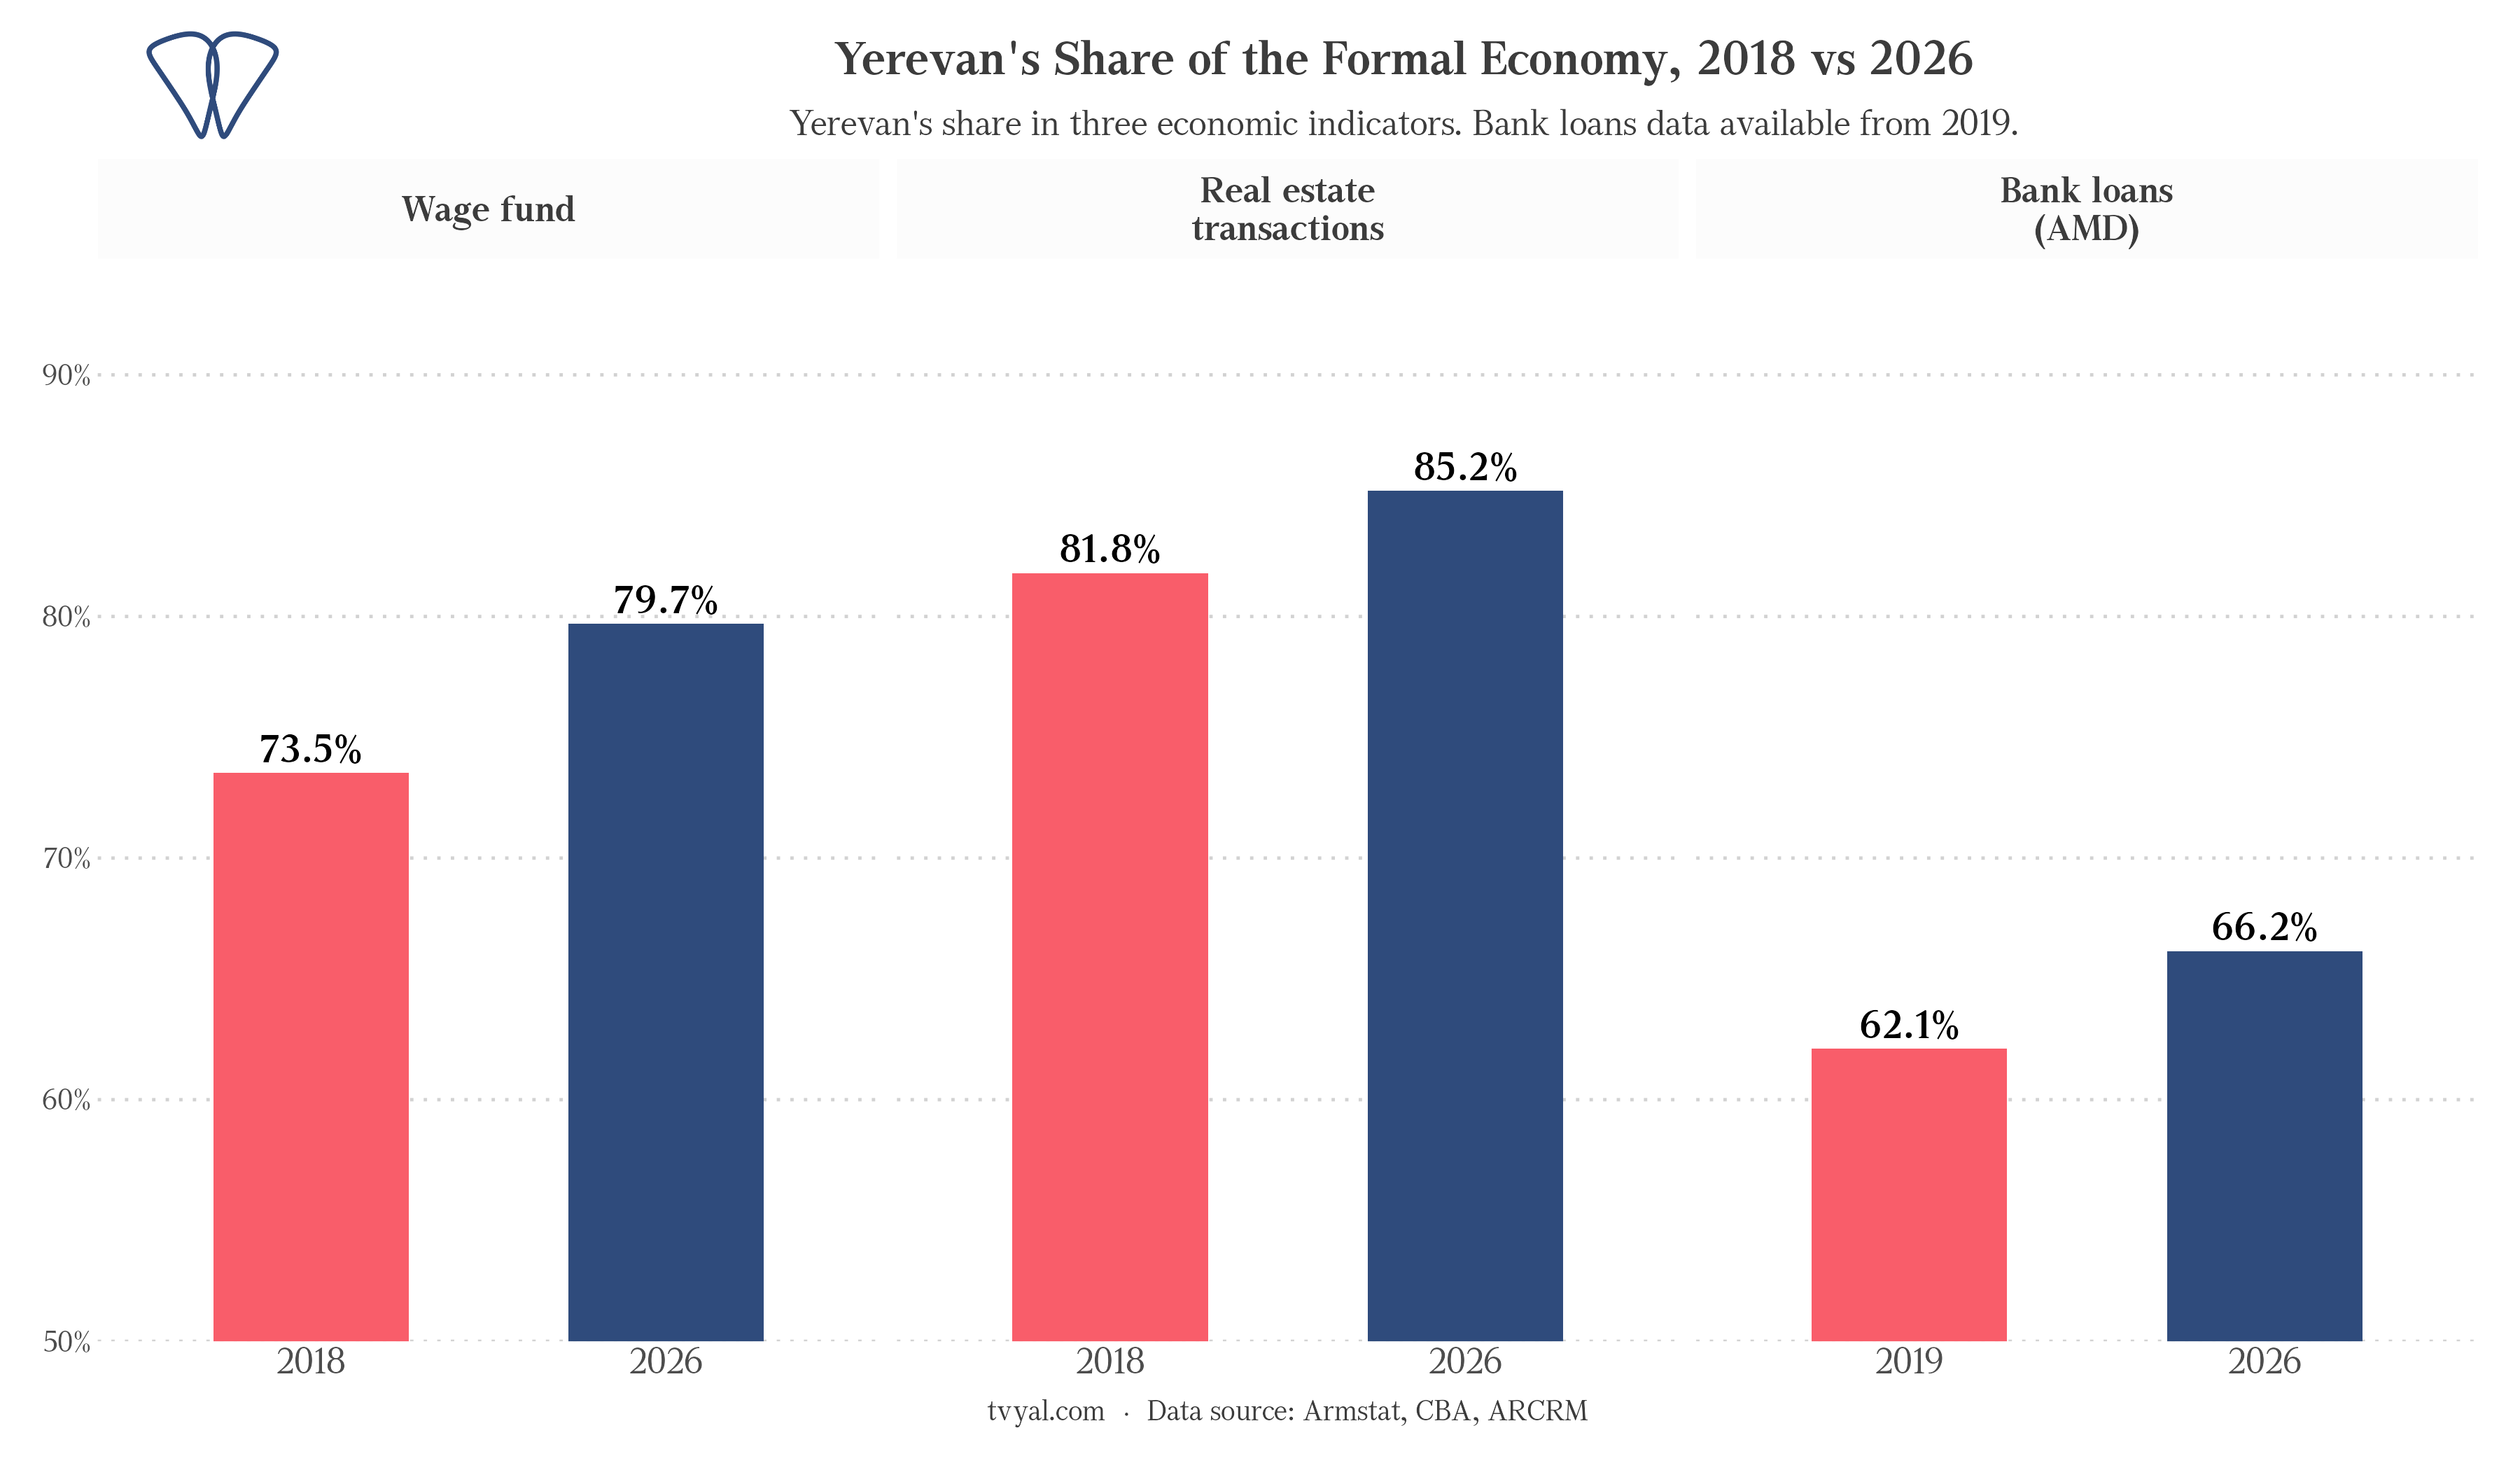
Yerevan holds 80% of the formal wage bill, 85% of real estate transactions[2], and 66% of AMD-denominated bank loans[3]. Armstat, the cadastre committee, and the CBA each count differently. All three point to the same city.
The loan share is the lowest of the three, but the 66% figure understates it. Short-term AMD loans (working capital, consumer credit in the capital) run about 73% through Yerevan. Foreign-currency loans go the other way: they concentrate in the regions, mostly agricultural credits and project financing that Yerevan doesn’t generate much demand for.
Six years and it hasn’t moved
Armenia’s economy grew. Employment rose, wages went up, GDP expanded. What the regional data adds is where. The formal wage bill concentration rose six percentage points over this government’s tenure and has not come back down. In most regions the state is still the main source of formal income — a structural condition that predates this government and has not changed during it.
The full time series of public versus private employment share is tracked monthly at tvyal.com/wages/trends, updated as Armstat publishes new data. To check where your own salary sits relative to this structure, the salary calculator at tvyal.com/wages breaks it down by NACE sector.
* Calculations and chart code: GitHub.
References
[1] Employment and wages by province // Armstat — armstat.am
[2] Statistical Bulletin, section 1.2.6 — Trade and other services // Armstat — 2018, Q1 2026
[3] Loans by region, time series // Central Bank of Armenia — cba.am