Three Elections, One Pattern: How Rising Turnout Impacts the Ruling Party's Vote
Three Armenian elections have now produced the same statistical result at the precinct level. Where more voters turned out, the ruling party received a smaller share of the vote. The relationship appeared in 2021 across 2,008 parliamentary precincts nationwide. It appeared again in the 2023 Yerevan city council elections across 475 precincts. In March 2025, across 82 Gyumri precincts, average turnout reached 42.6%, the ruling party received 36.7% of votes, and it lost control of the council.
June 7 will be the fourth observation.
The 2021 parliamentary elections
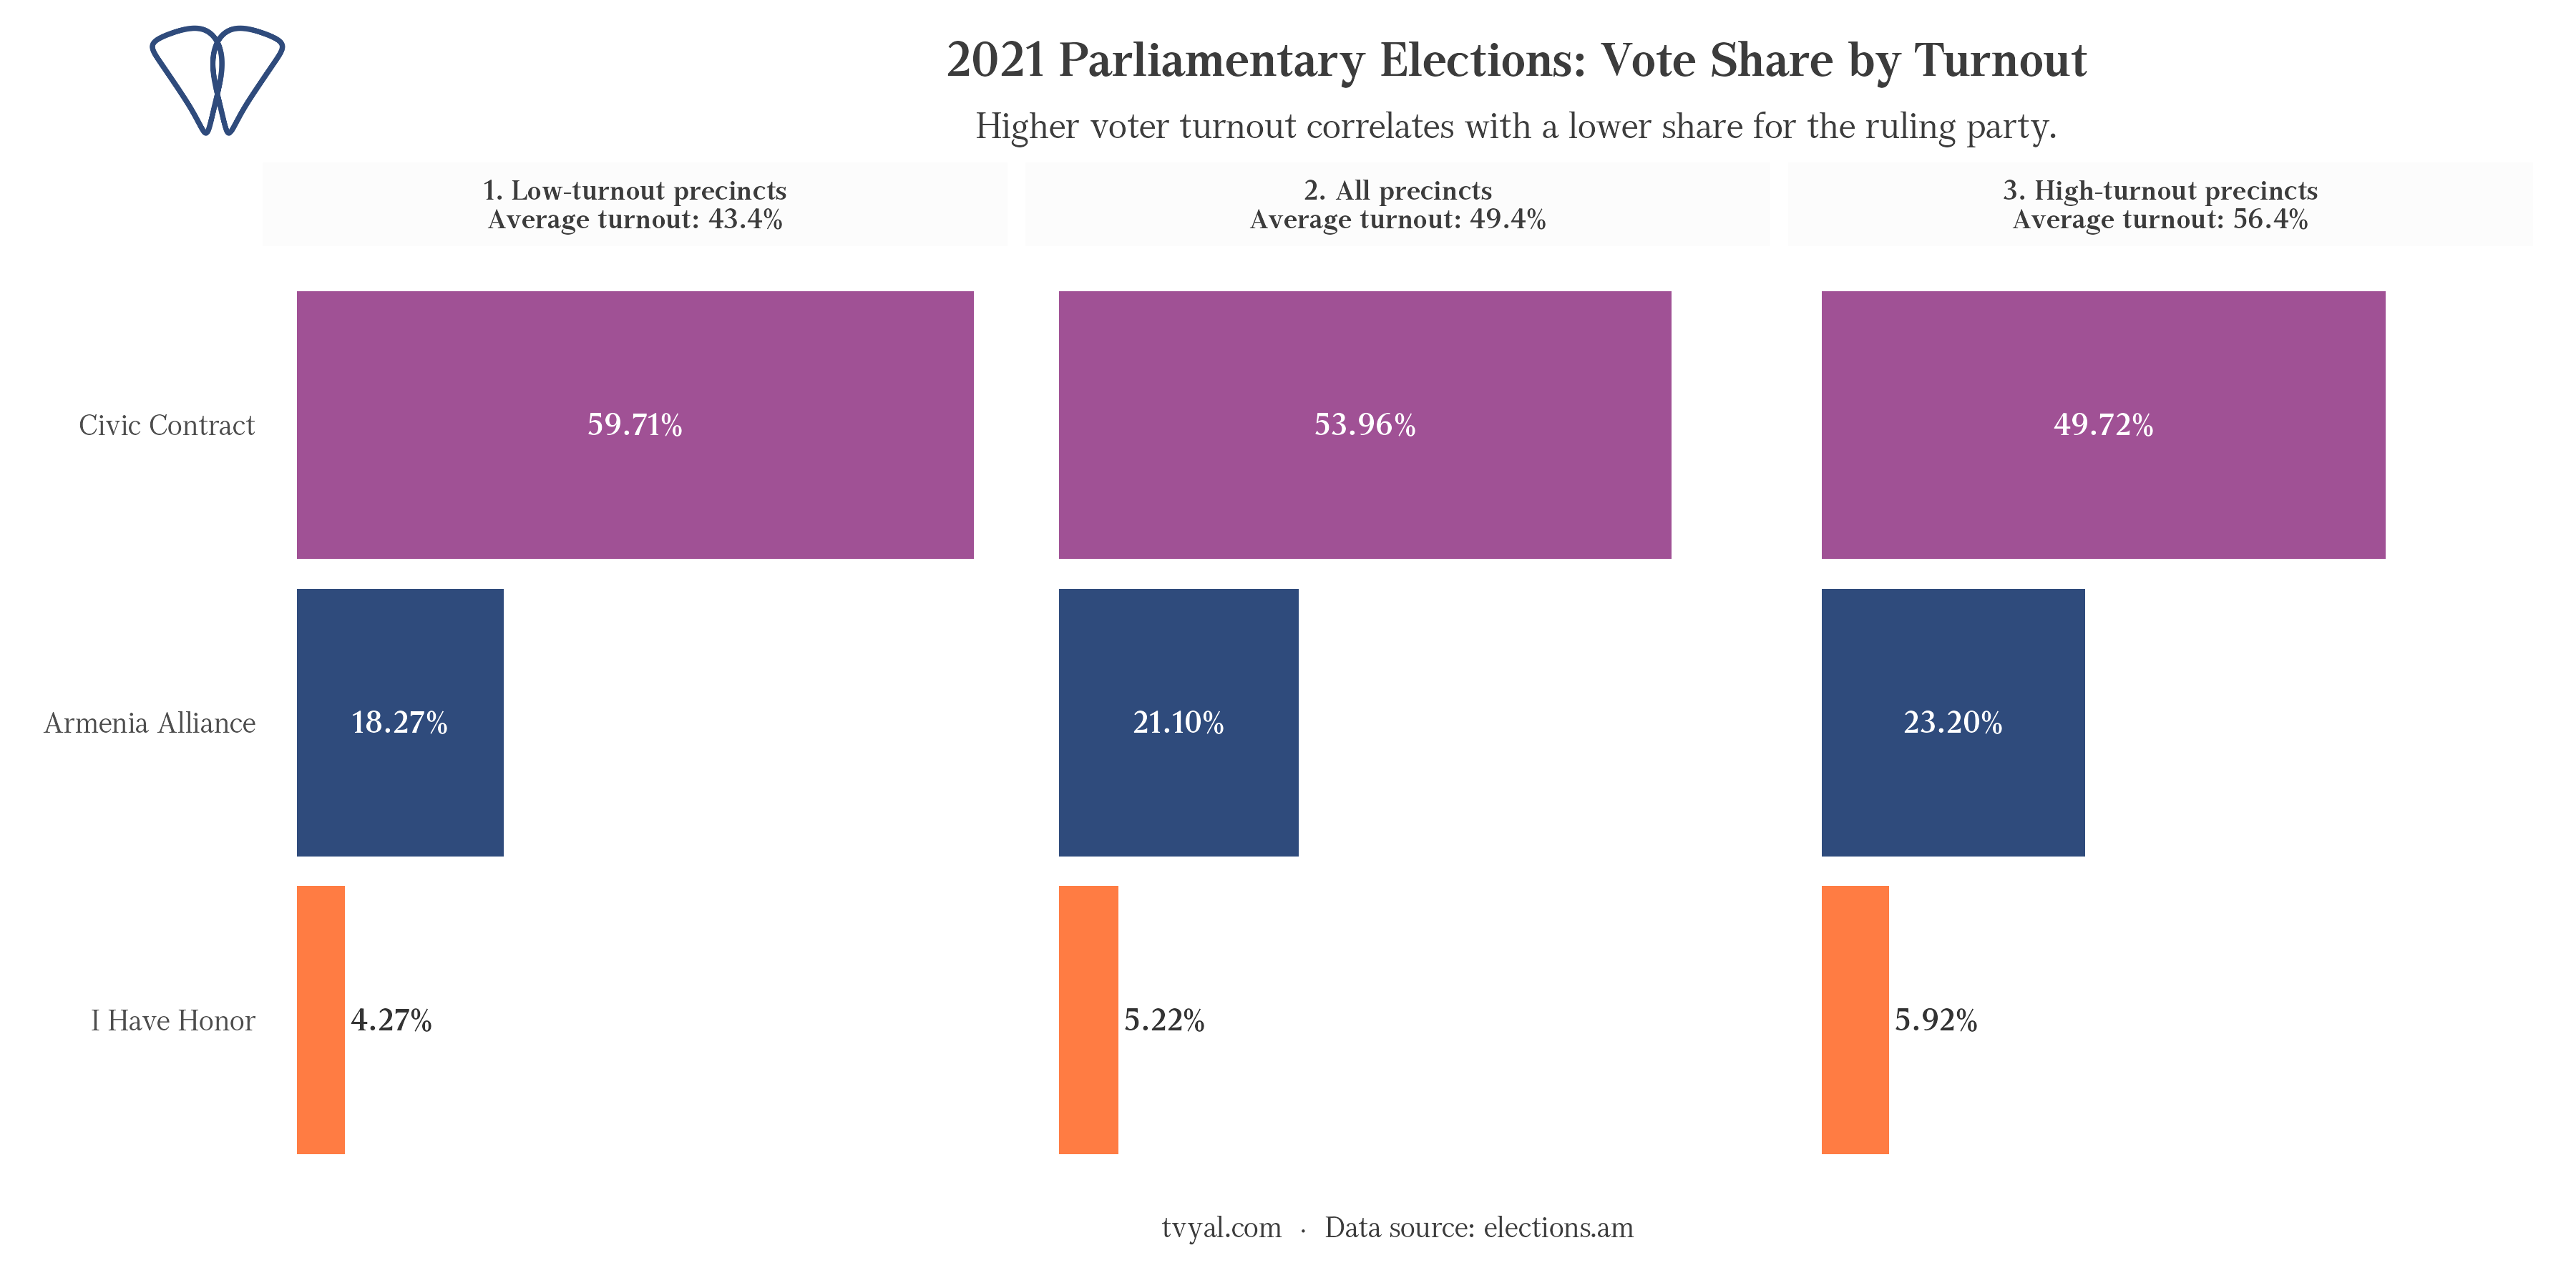
Three parties crossed the 5% national threshold in 2021: Civic Contract at 53.96%, Armenia Alliance at 21.10%, and I Have Honor at 5.22%. Average turnout across 2,008 precincts was 49.4%. [1]
When precincts are sorted by participation rate, the pattern is clear. Where fewer people voted, Civic Contract finished above its national average. Where more people voted, its share fell below. Armenia Alliance moved the other way: better results in the precincts with higher turnout.
| Party | Votes | Share | Correlation with turnout |
|---|---|---|---|
| Civic Contract | 688,598 | 53.96% | -0.267 |
| Armenia Alliance | 269,346 | 21.10% | +0.274 |
| I Have Honor | 66,636 | 5.22% | +0.051 |
This relationship held across all 2,008 precincts, in different regions, with different demographic profiles. It is not a local anomaly.
The 2023 Yerevan city council elections
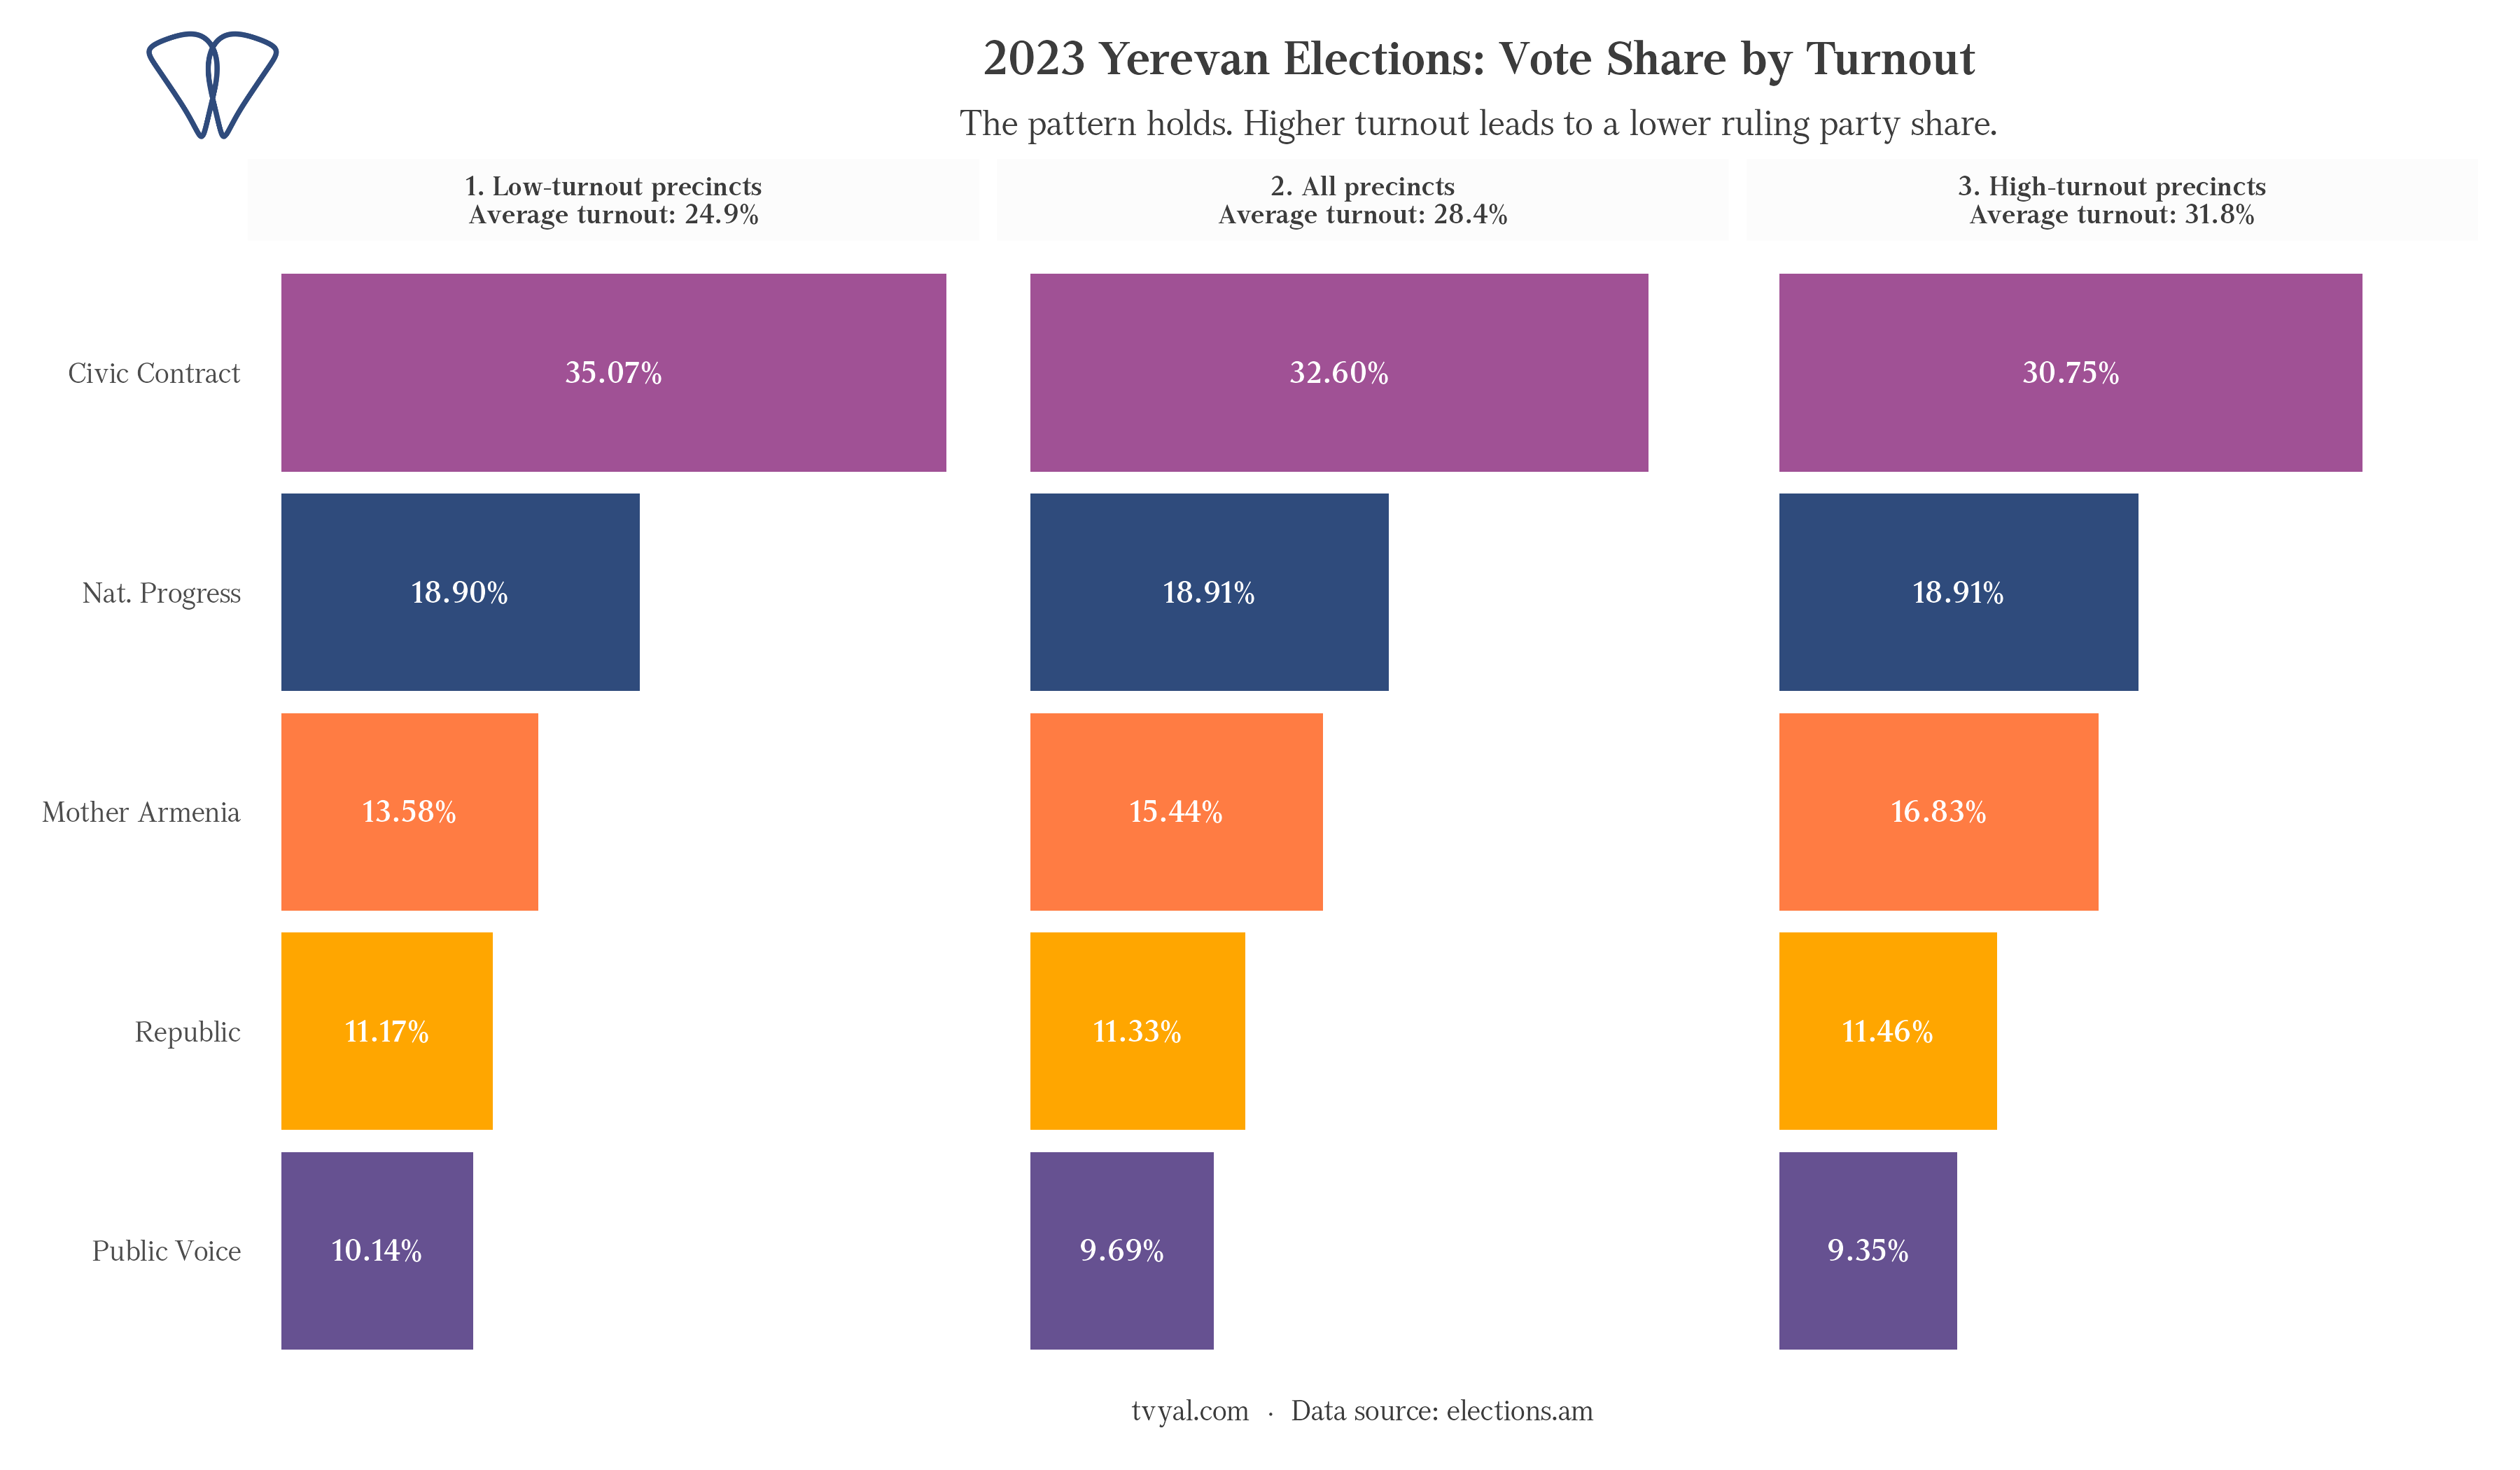
The 2023 Yerevan elections are a more contained dataset: 475 precincts, one city, five parties above threshold, average turnout of 28.4%. Civic Contract received 32.60% of the vote. [2]
The same pattern holds. Civic Contract’s share dropped in precincts where more people voted and rose where fewer did. Mother Armenia moved in the sharpest opposite direction: it performed best precisely in the precincts where turnout was highest.
| Party | Votes | Share | Correlation with turnout |
|---|---|---|---|
| Civic Contract | 75,463 | 32.60% | -0.329 |
| Nat. Progress | 43,765 | 18.91% | +0.016 |
| Mother Armenia | 35,739 | 15.44% | +0.390 |
| Republic | 26,236 | 11.33% | +0.118 |
| Public Voice | 22,431 | 9.69% | -0.184 |
Two elections, different scale, same direction.
Gyumri 2025: when the pattern had a result
The March 2025 Gyumri municipal elections followed the same statistical logic but added something the first two elections do not have: an outcome.
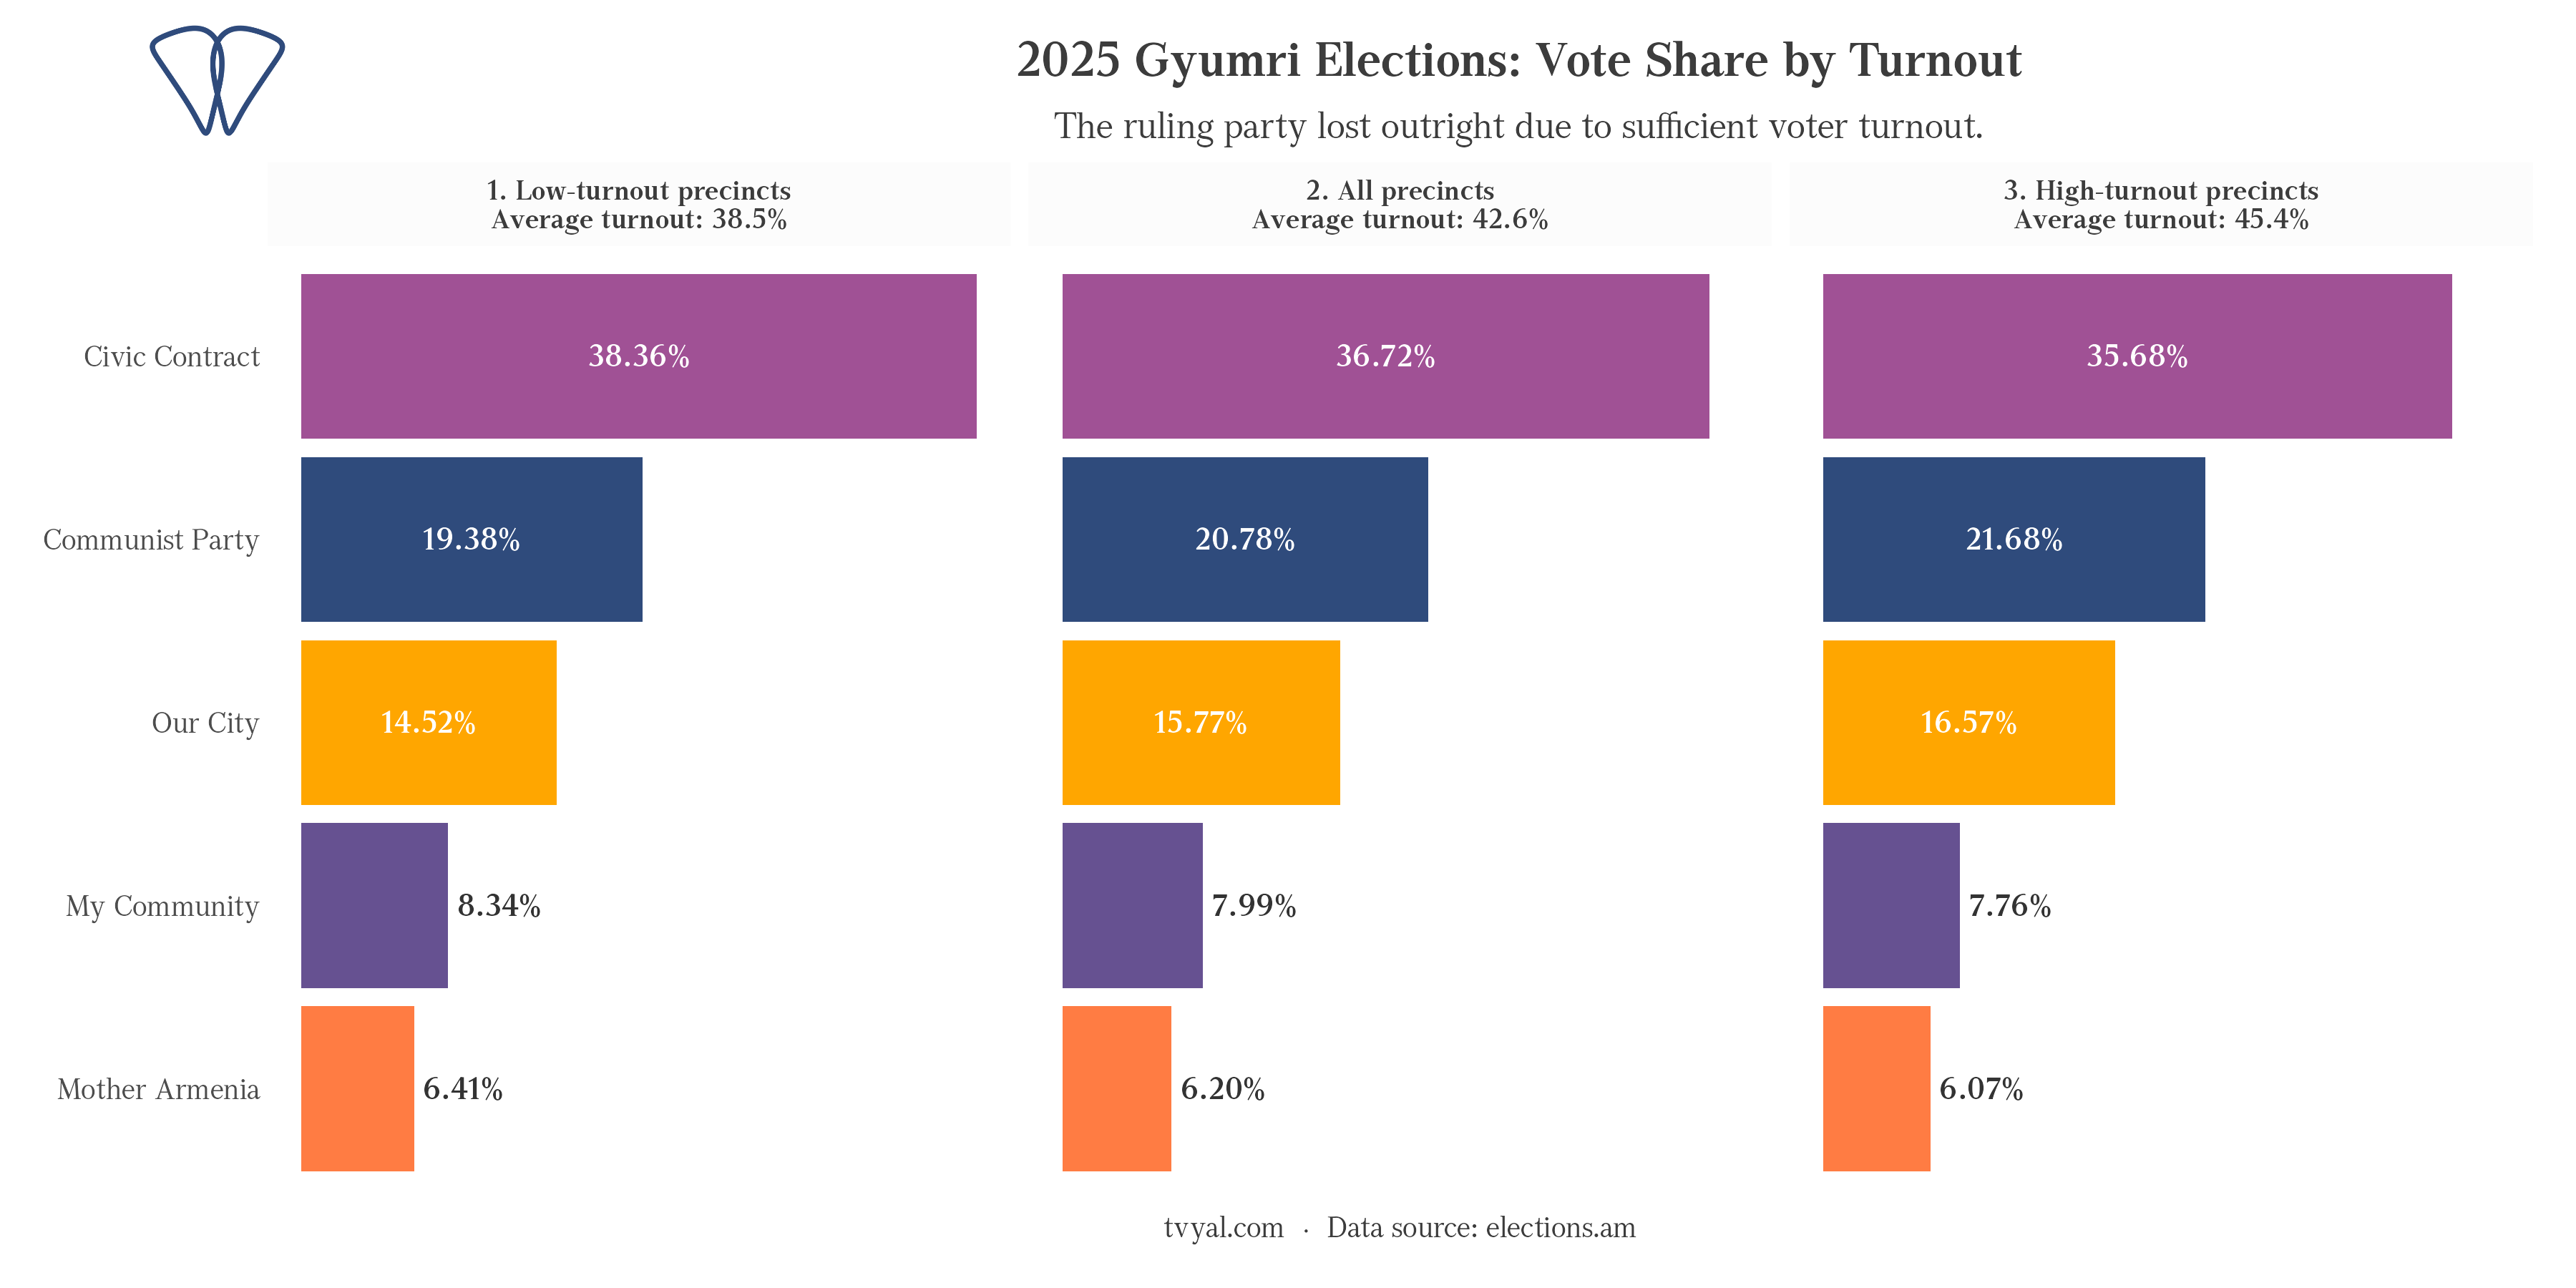
Average turnout reached 42.6% across 82 precincts. Civic Contract received 36.72%, the largest single share of any party. [3] No opposition party came close to winning outright. What happened is that the combined opposition vote exceeded the ruling party’s total, and a council majority formed against it. Civic Contract lost control of the city.
| Party | Votes | Share | Correlation with turnout |
|---|---|---|---|
| Civic Contract | 17,188 | 36.72% | -0.193 |
| Communist Party | 9,727 | 20.78% | +0.101 |
| Our City | 7,380 | 15.77% | +0.184 |
| My Community | 3,739 | 7.99% | -0.051 |
| Mother Armenia | 2,904 | 6.20% | +0.016 |
Civic Contract held the largest individual share of any party in Gyumri and still lost. No single opposition party came close to winning outright. Together, they exceeded it. That is what a high-turnout election produces when the ruling party’s support is spread unevenly across precincts.
The relationship ran in the same direction as in 2021 and 2023: higher-turnout precincts returned a lower share for Civic Contract. More people voted. The distribution shifted enough to change the result.
The pattern across all three elections
The chart below places every precinct from all three elections on the same axes: Civic Contract’s vote share on the horizontal axis, voter participation on the vertical. Each dot is one precinct.
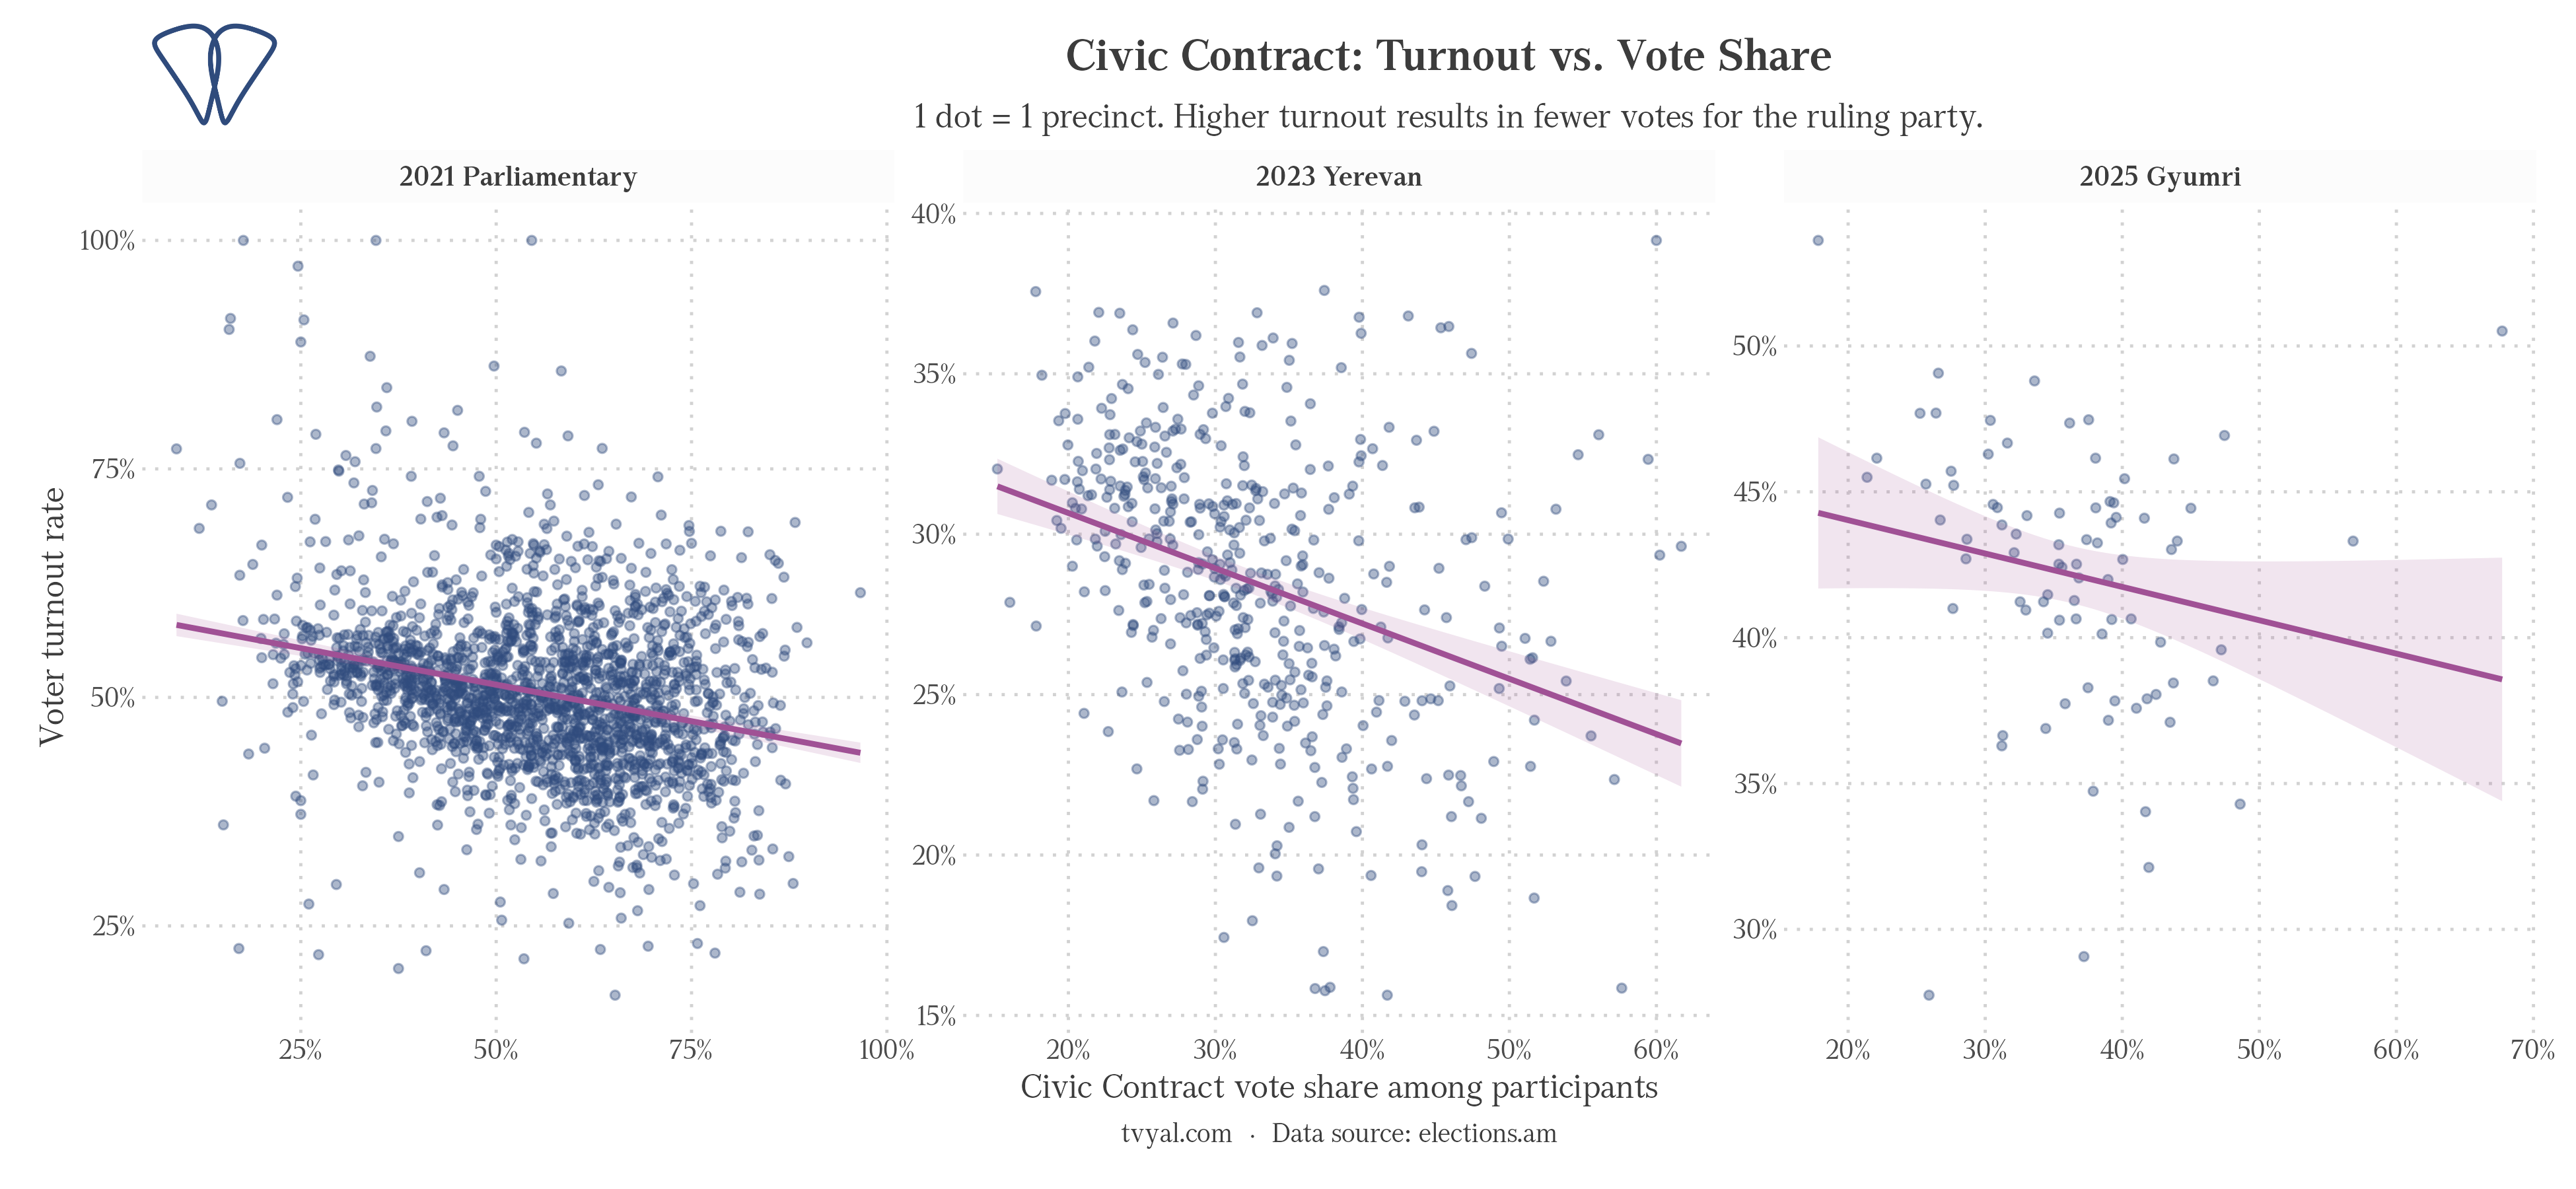
In all three panels the line runs downward: precincts with more voters gave Civic Contract a smaller share. The elections happened in different years, at different scales, in different parts of the country. The direction does not change.
What the data suggests for June 7
The June 7 elections cover the whole country, with more parties and a different political configuration than any of the three elections in this analysis.
The data from 2021, 2023, and 2025 says the same thing each time: where more people voted, the ruling party received a smaller share. In Gyumri, that share was still the largest of any single party. It was not enough.
This wasn’t always the pattern. In December 2018, seven months after the Velvet Revolution put it in power, the My Step Alliance — later renamed Civic Contract — showed a correlation of just -0.086 between precinct turnout and its vote share across 2,010 precincts. Statistically indistinguishable from zero. By 2021, after three years in office and a lost war, the correlation had reached -0.267. What changed between 2018 and 2021 was not the electoral map. It was the time the ruling party had been in office.
Armenia’s parliamentary elections use a proportional system. Every vote contributes directly to seat allocation. There is no precinct where a vote counts less.
The data has shown the same pattern three times. The fourth observation is two days away.
* All data sourced from the Central Election Commission of Armenia (elections.am). Analysis covers precincts with non-zero registered voters and non-zero participants. Pearson correlation computed at the precinct level for parties receiving 5% or more of total votes in each election. Calculations and chart code available on GitHub.
References
[1] Extraordinary Parliamentary Elections, 20 June 2021 — precinct-level results // Central Election Commission of Armenia — elections.am/Elections/Parliamentary
[2] Yerevan City Council Elections, 17 September 2023 — precinct-level results // Central Election Commission of Armenia — elections.am/Elections/LocalProportional
[3] Gyumri Municipal Elections, 30 March 2025 — precinct-level results // Central Election Commission of Armenia — elections.am/Elections/LocalProportional