Record Turnout Without Change: The Real Surprise of Armenia's 2026 Election
In 2018, a revolution brought voters to the polls. In 2021, a lost war did. In 2026, nothing obvious did. Yet roughly 195,000 more Armenians cast ballots than five years earlier, on a voter list that had shrunk by 91,000. Turnout reached 58.97 percent, higher than even the 2018 post-Velvet-Revolution election.
Civic Contract won: 64 of 105 parliamentary seats, just under 50 percent of the valid vote. But the structure of electoral behavior has fundamentally shifted. The precinct-level pattern from the previous three elections, where higher turnout meant a smaller share for the ruling party, no longer operates at the national level. The national correlation was +0.012. Statistically indistinguishable from zero.
Where high turnout helped the ruling party, and where it didn’t
In 2021, nearly the whole map ran red: higher-turnout precincts gave Civic Contract a smaller share. The 2026 map looks different.
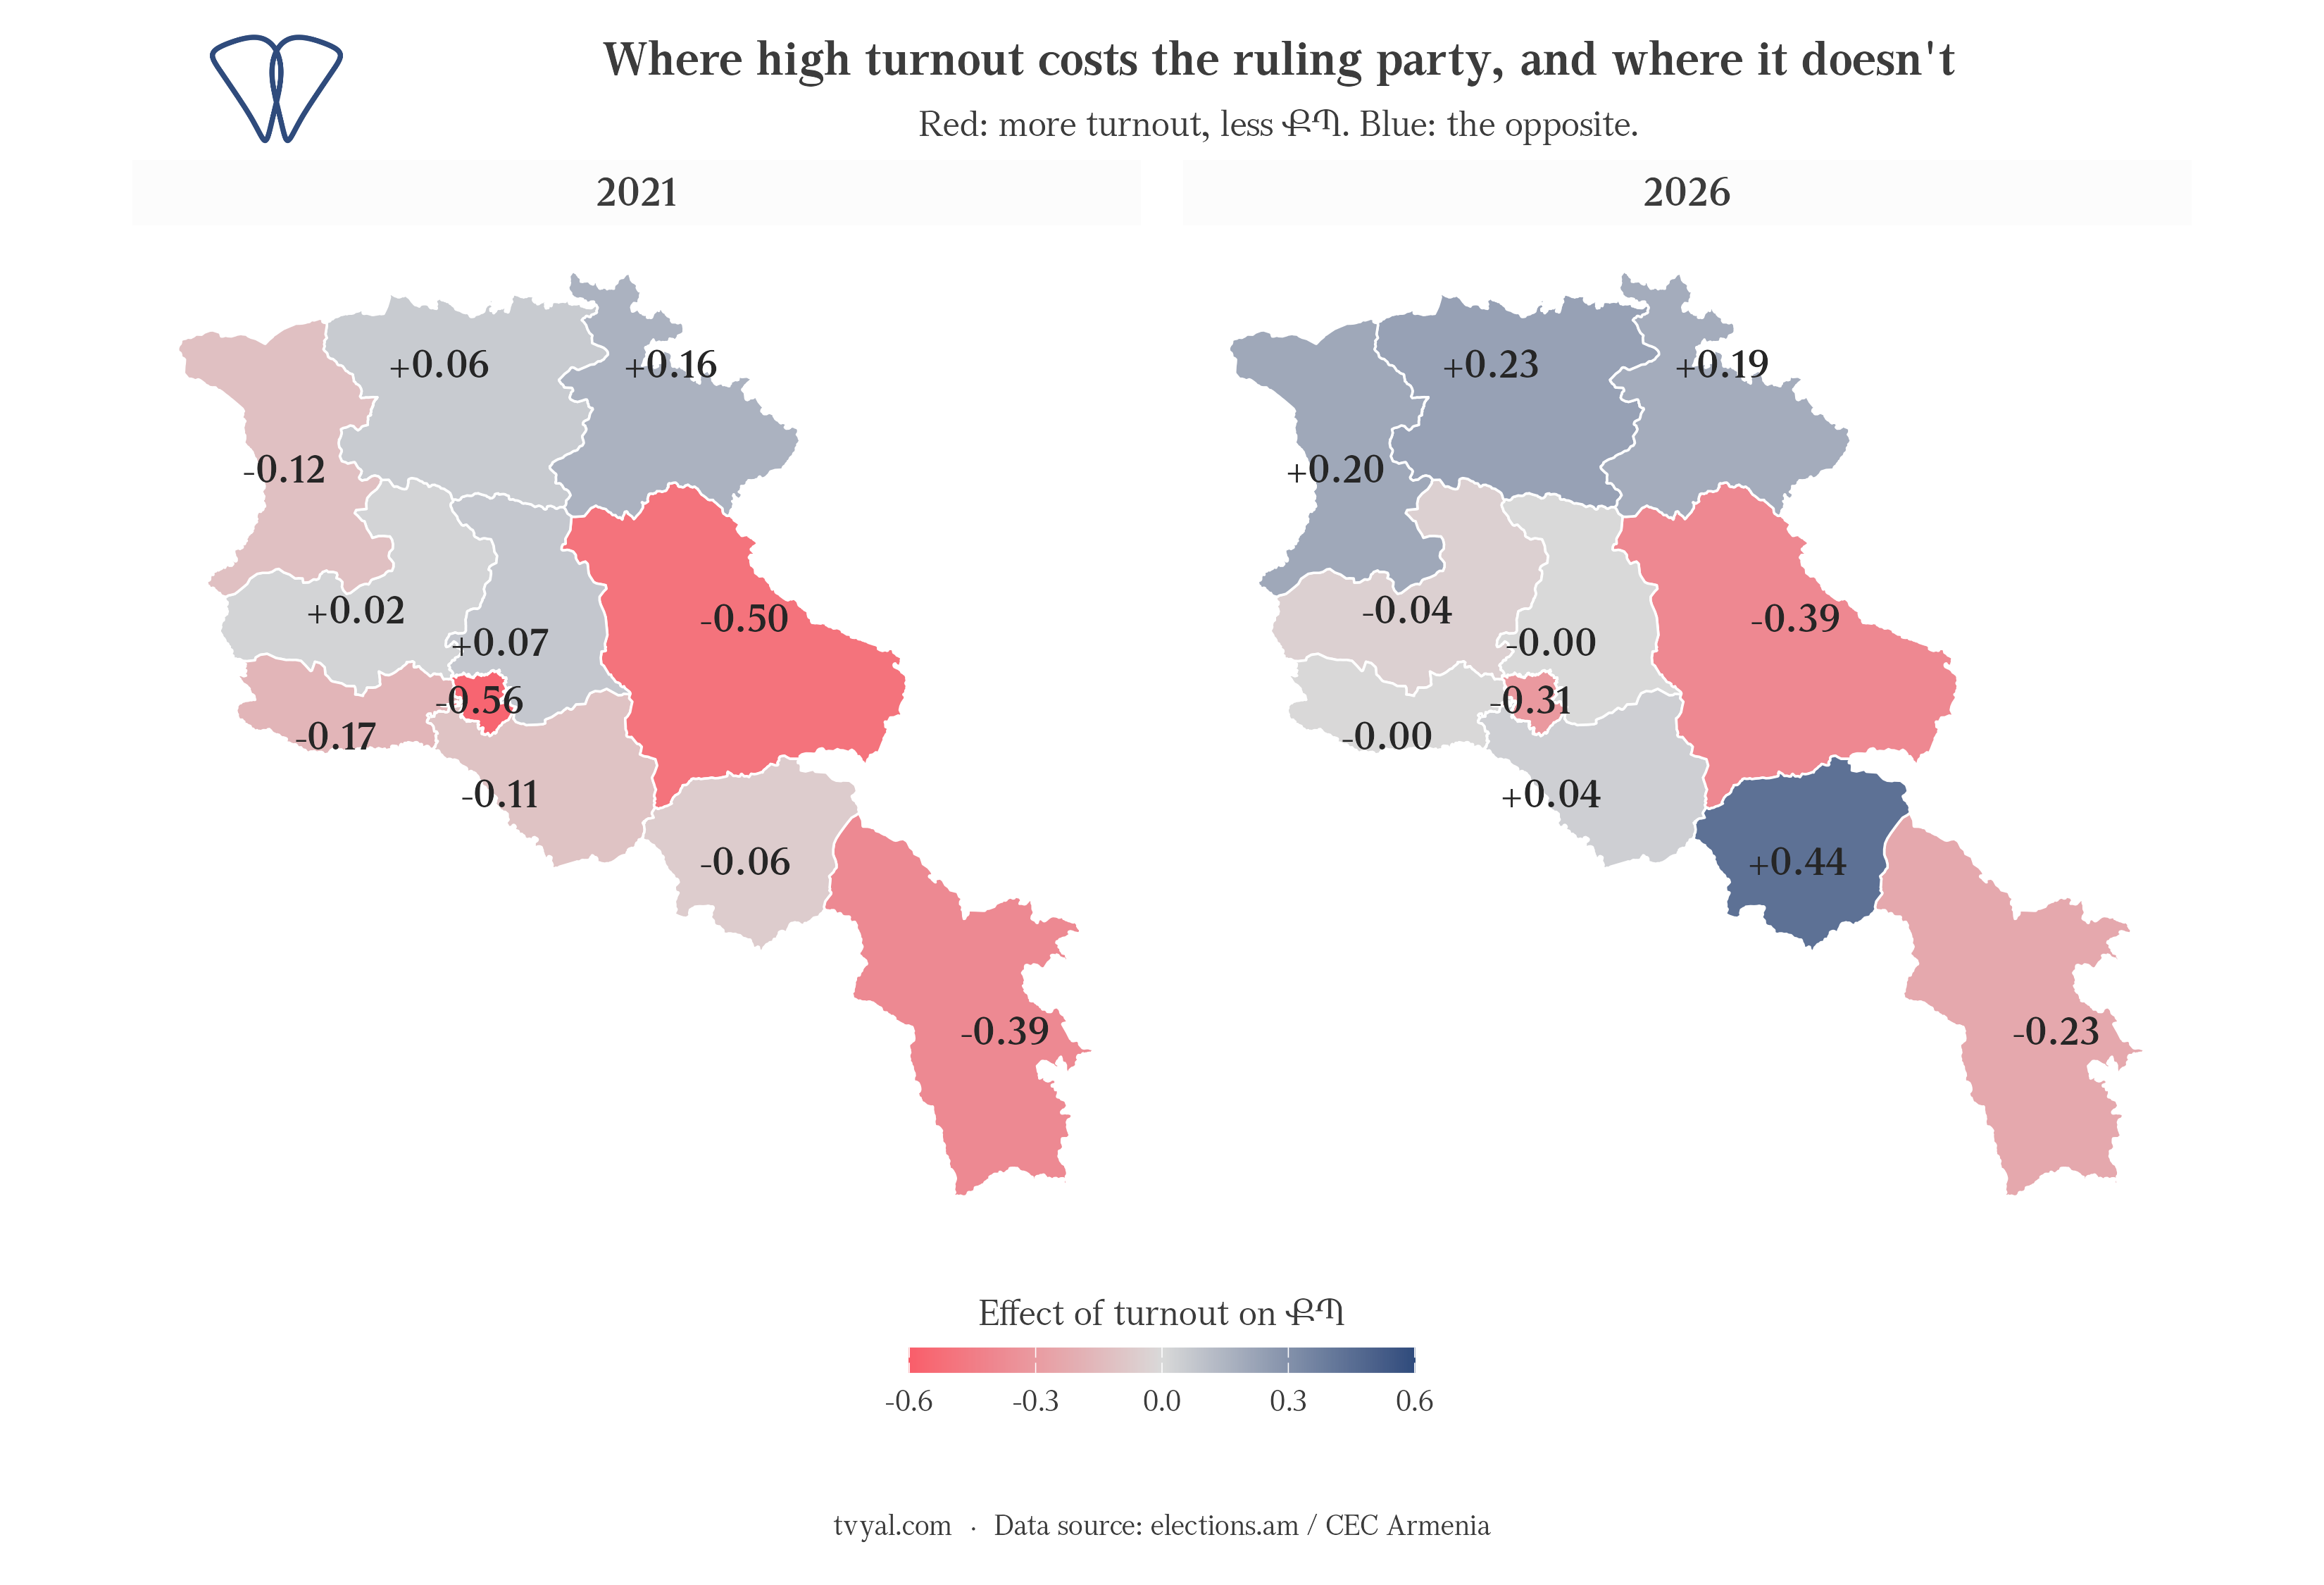
The negative relationship from 2021 has mostly been neutralized or flipped positive. The northern marzes (Lori, Shirak, Tavush) now show a positive correlation between turnout and the ruling party’s vote share. The sharpest reversal was in Vayots Dzor, where the coefficient went from -0.06 to +0.44 — though with only 53 precincts, statistical noise is a larger factor than in the bigger marzes. The negative correlation held only in Yerevan, Gegharkunik, and Syunik, where higher voter turnout still translated into fewer votes for the ruling party.
This divergence in dynamics is driven by clear economic factors. Shirak, where the negative trend flipped to positive, has Armenia’s highest poverty rate at 42 percent, against a national average of 23.5 percent; state-sector salaries are the primary income source in the region, and the marz’s average nominal wage is around 161,000 AMD, roughly half the national average of 308,000 AMD. Syunik, which held the negative relationship, has the lowest poverty rate in the country at 16.7 percent; its mining sector pays on average 545,000 AMD per month, and the marz’s average wage of 345,000 AMD (close to Yerevan’s 356,000) is more than double Shirak’s. In effect, the geography of electoral behavior mirrors the geography of economic indicators.
The two border marzes that held the negative relationship still face unresolved border-related problems. In Gegharkunik, the Sotk gold mine’s open-pit operations were suspended following the September 2022 military operations, leaving many workers in the Vardenis area on reduced schedules; the partial shutdown persisted through election day. As the entry point of the Lachin corridor connecting to Artsakh, Syunik directly bore the consequences of the 2022 blockade and the September 2023 ethnic cleansing of the region. Yerevan operates by a different logic: the capital’s economy is sufficiently diversified that state-sector employment is not the dominant income source. Even so, without precinct-level survey data, we can only record that the trend persists in these marzes — not establish full causal relationships. In Yerevan, the opposition’s share is highest in the Kentron and Arabkir administrative districts.
| Marz | r (2021) | r (2026) | Change |
|---|---|---|---|
| Yerevan | -0.563 | -0.312 | Negative, weakened |
| Gegharkunik | -0.500 | -0.390 | Negative, weakened |
| Syunik | -0.386 | -0.234 | Negative, weakened |
| Armavir | -0.172 | -0.003 | Erased |
| Shirak | -0.118 | +0.203 | Sign-flip |
| Ararat | -0.107 | +0.039 | Erased |
| Vayots Dzor | -0.064 | +0.436 | Sign-flip (n = 53) |
| Aragatsotn | +0.021 | -0.042 | Near zero |
| Lori | +0.058 | +0.231 | Positive, strengthened |
| Kotayk | +0.074 | -0.001 | Near zero |
| Tavush | +0.163 | +0.186 | Stable positive |
| National | -0.267 | +0.012 | Pattern dissolved nationally |
The pattern that held across three consecutive elections survived in three marzes. In the other eight, it no longer appears. In two of those eight, the relationship reversed.
Turnout in three parliamentary elections
The orange bar stands nearly ten points above either of the two previous parliamentary elections.
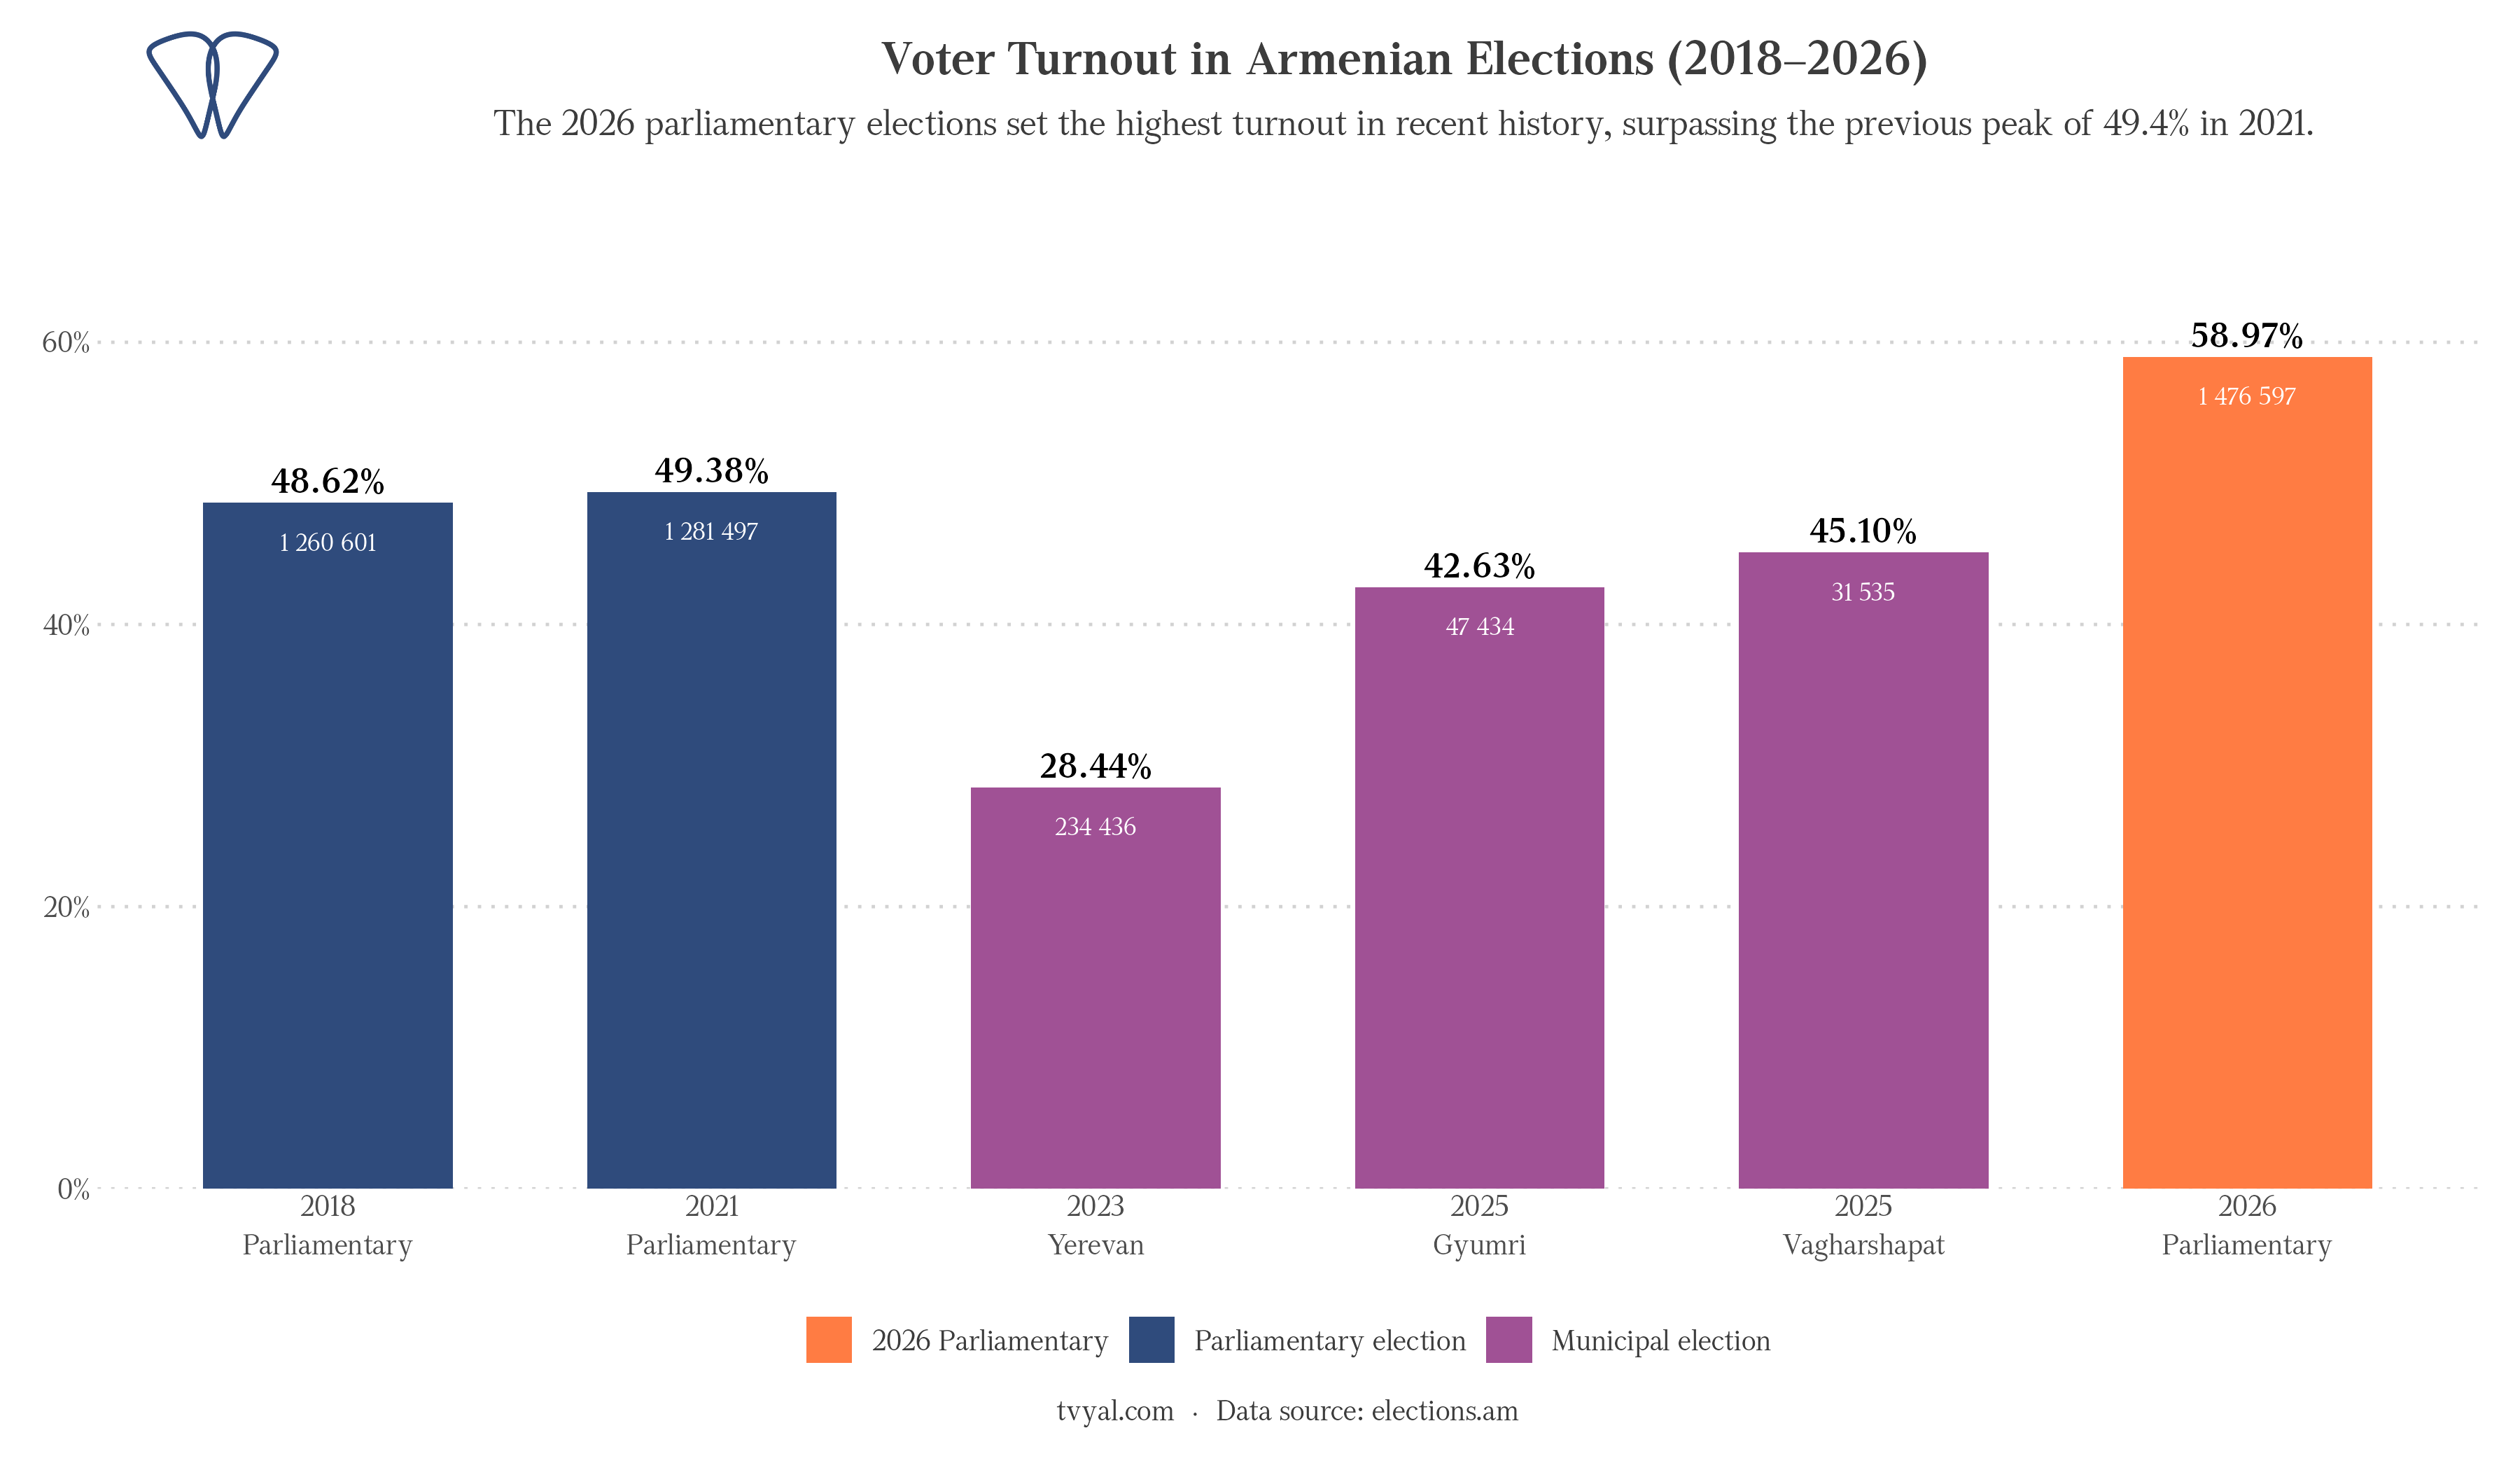
Turnout was 48.6 percent in 2018 and 49.4 percent in 2021. Both arrived after defining events. The 2026 vote did not.
The 2026 vote by party and by marz
The four parties that cleared the threshold drew from different parts of the country.
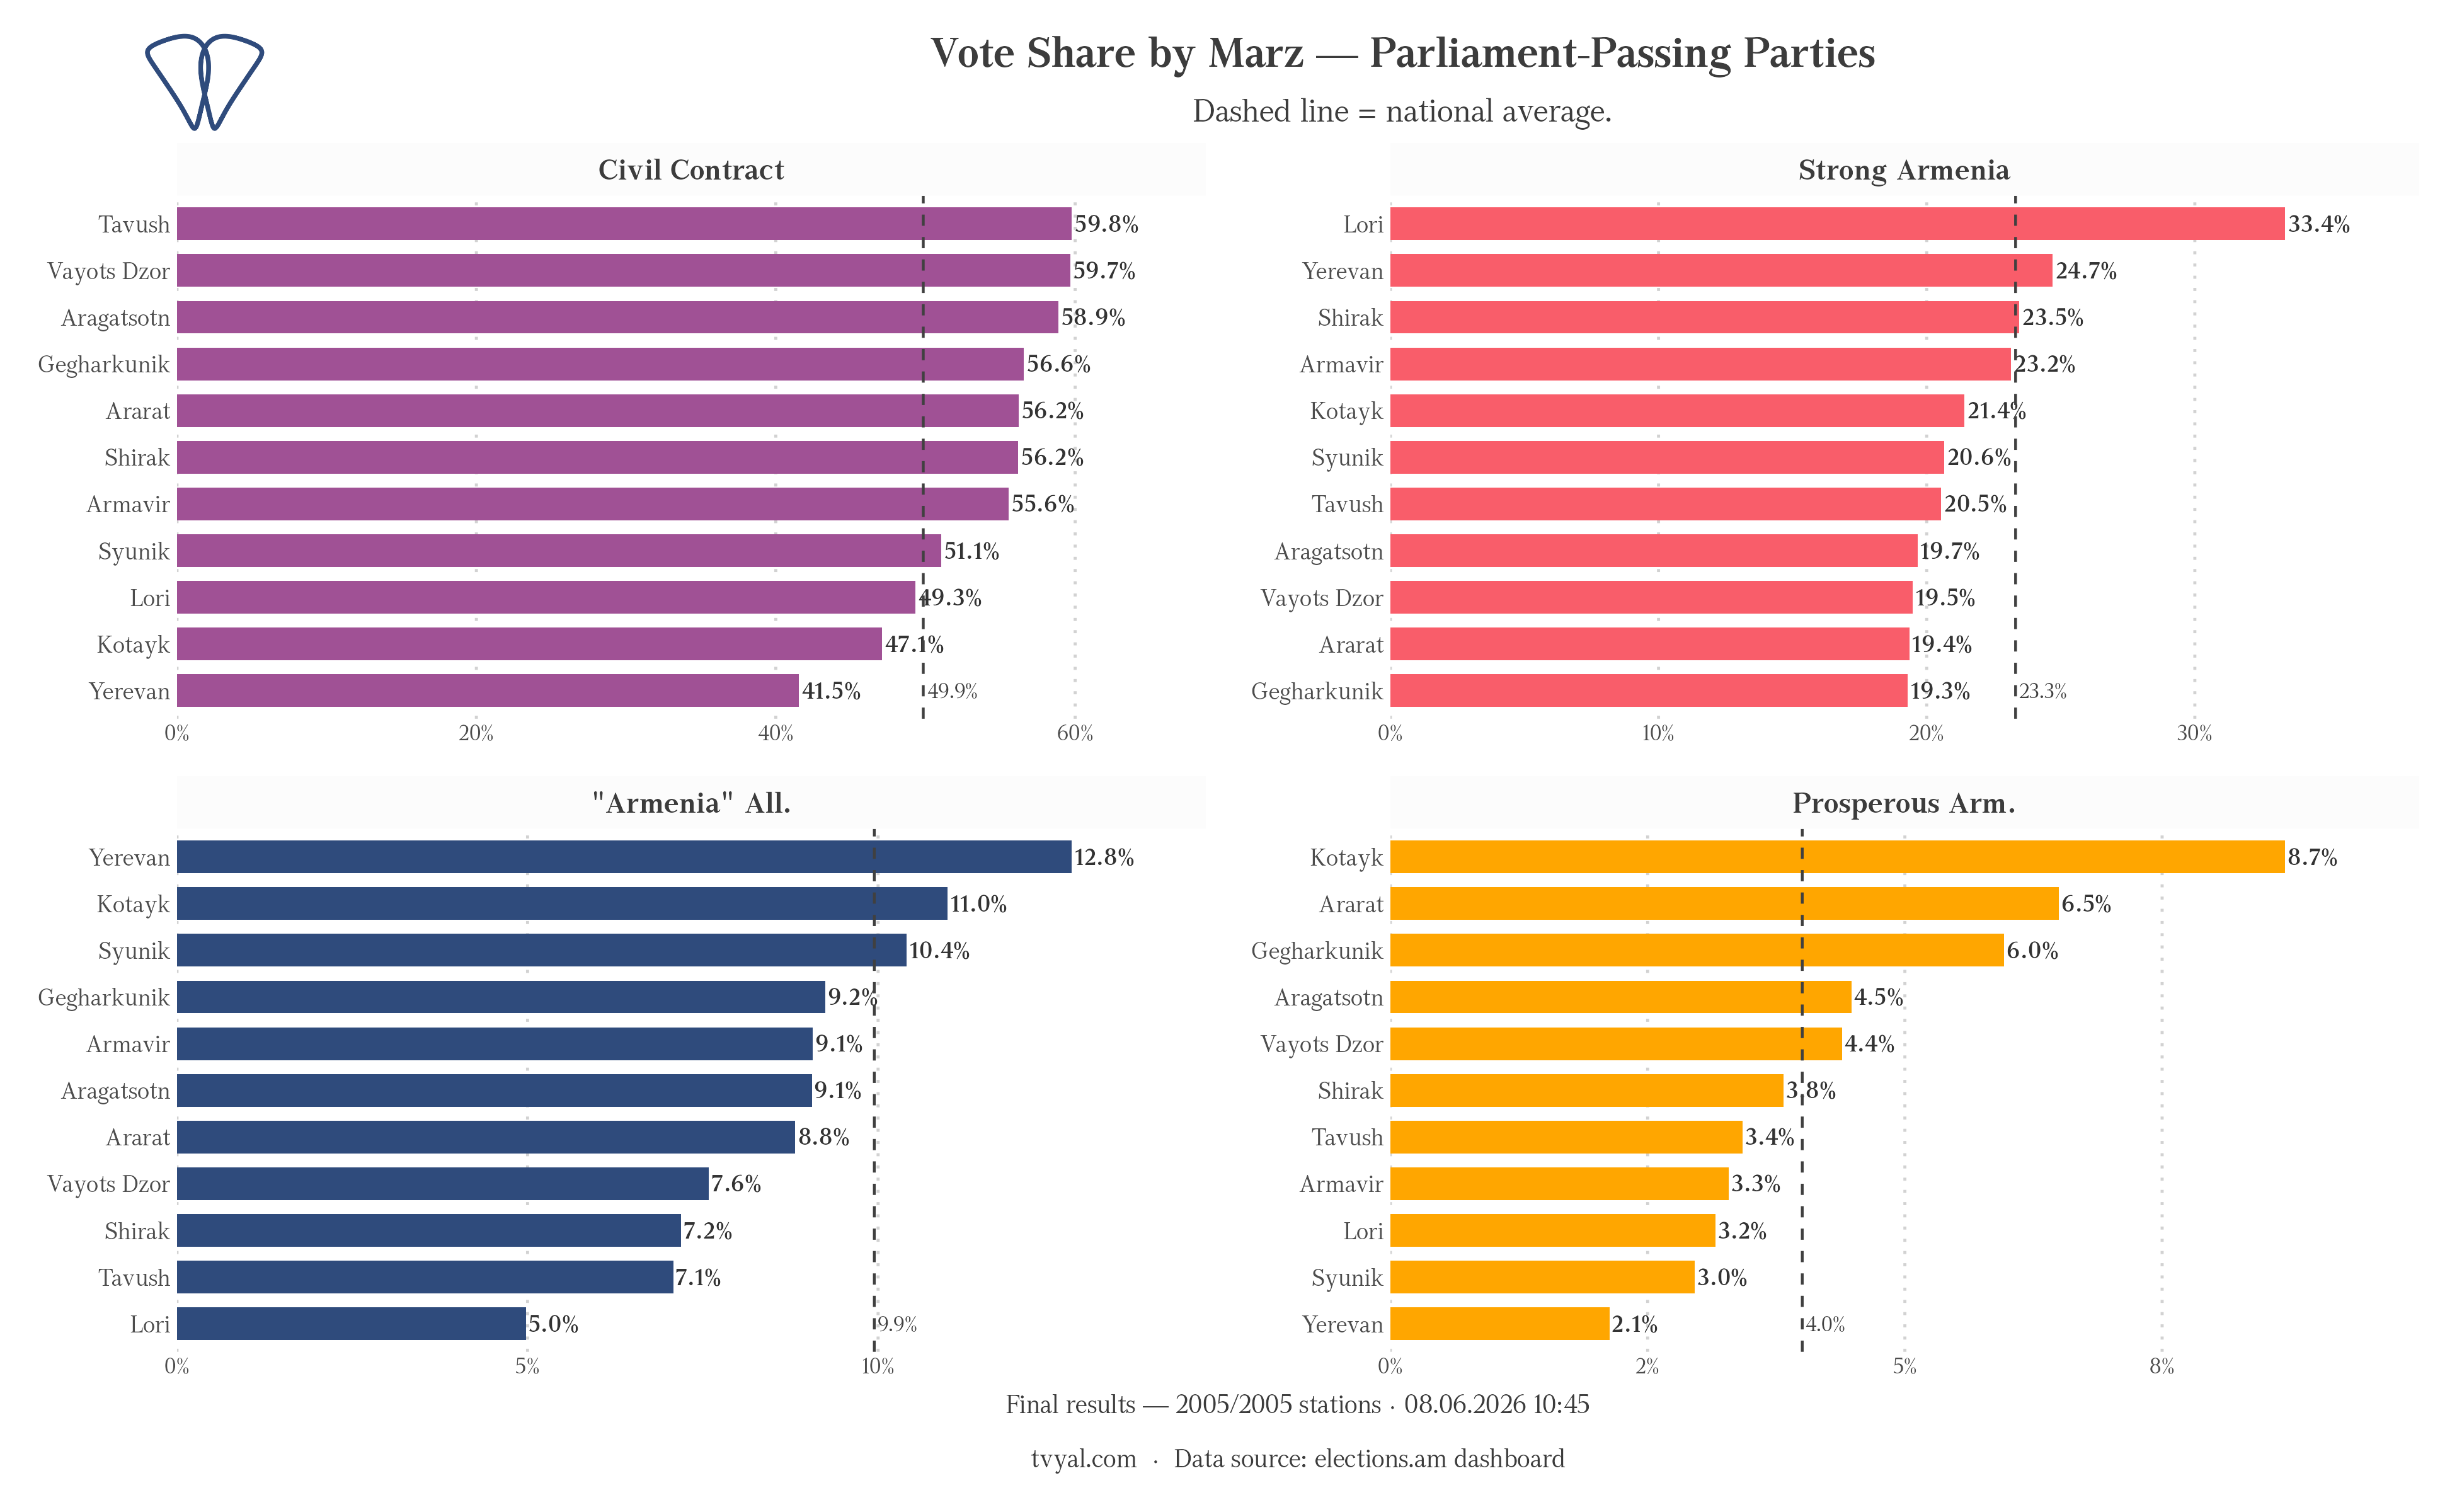
Civic Contract carried every marz. Its weakest result was Yerevan at 41.5 percent; its strongest were Tavush and Vayots Dzor approaching 60 percent. Strong Armenia’s best marz was not Yerevan (24.7 percent, second place) but Lori, at 33.4 percent. The Armenia Alliance ran in nearly the opposite direction: strongest in Yerevan at 12.8 percent, weakest in Lori at 5.0 percent. The two opposition alliances drew from almost opposite regional bases.
Prosperous Armenia did not make it — by 709 votes.
Prosperous Armenia received 58,368 votes. The election dashboard shows 4.00 percent, which clears the threshold. The Electoral Code draws the base more broadly: it includes all ballots cast in favor of any party, even those with minor marking irregularities, adding 18,239 to the denominator. Against that wider total, the same 58,368 votes come to 3.953 percent. Short by 709 votes. [1]
The mandates of the National Assembly shall be distributed among the electoral lists of those parties that have received, of the total number of FOR-ballots and inaccuracies, in the case of a party, 4 percent.
That denominator distinction is what kept a fourth party out of parliament.
A larger turnout, a smaller mandate
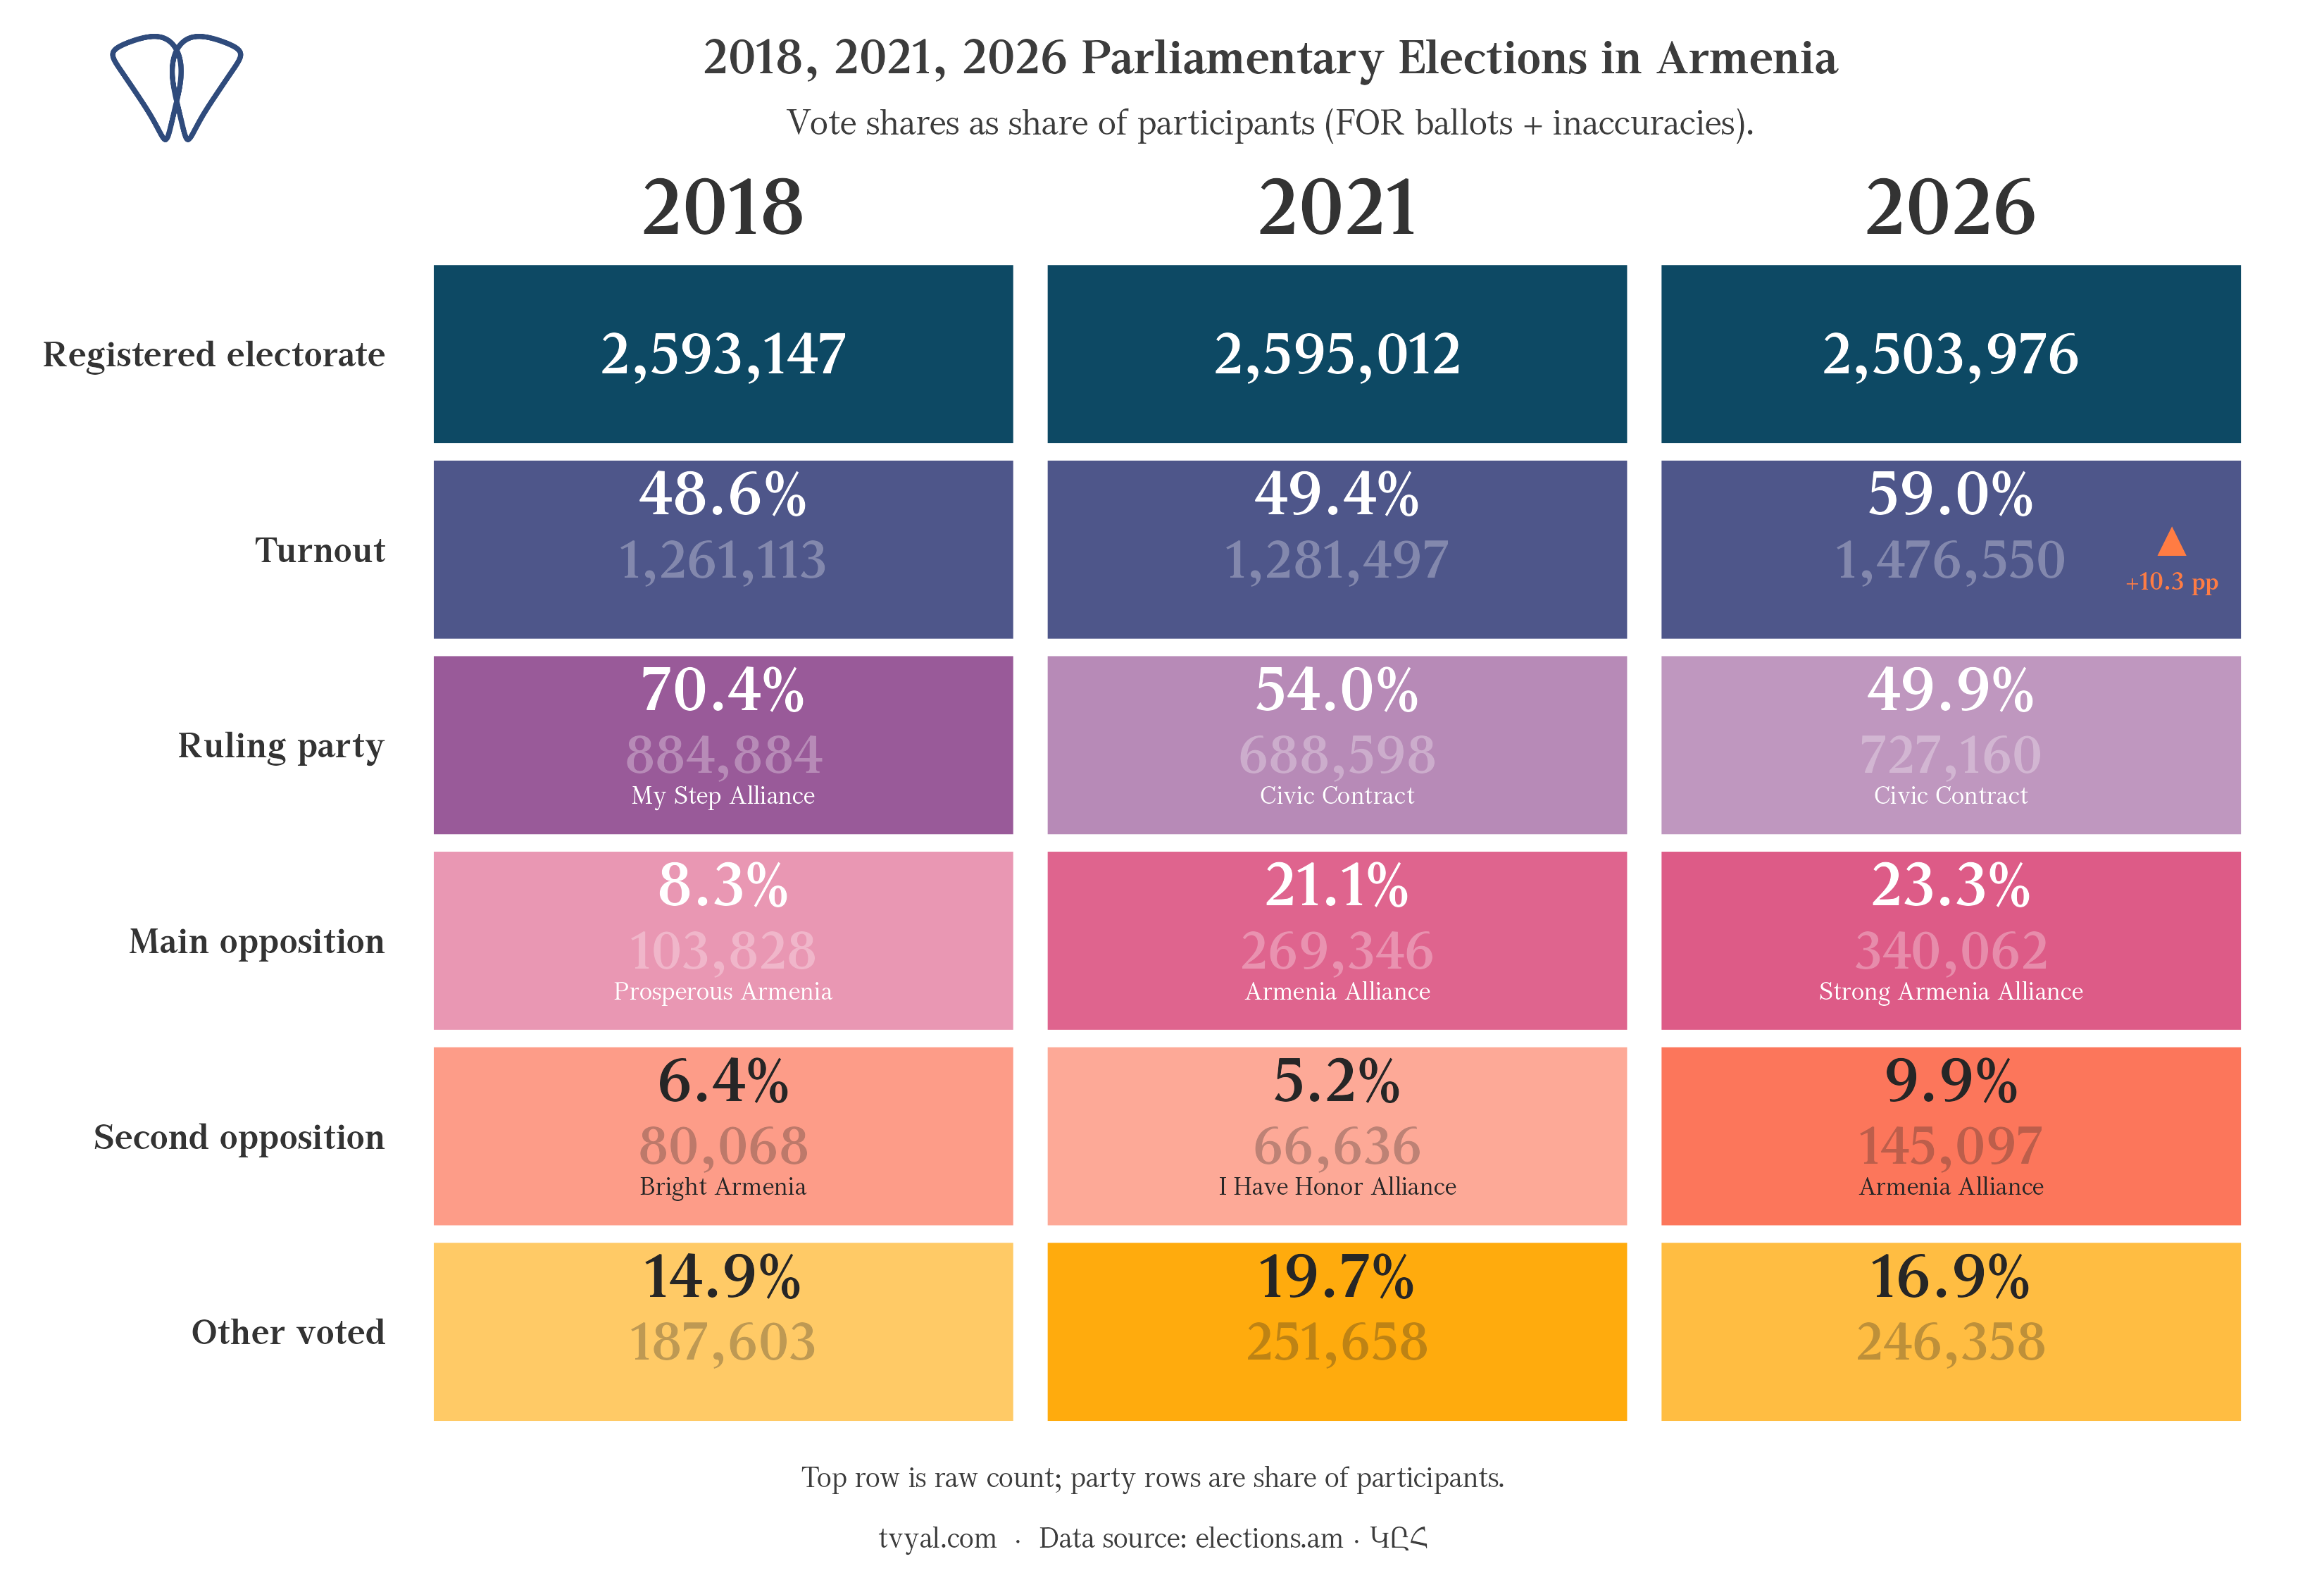
The most objective measure of a ruling party’s standing is its share of votes within the total number of registered voters. That figure is free of the statistical distortions that come from changes in the number of voters who stay home.
My Step in 2018 took 70.4 percent of valid votes, or 34.1 percent of the registered electorate. Civic Contract in 2021 took 54.0 percent of valid votes, or 26.5 percent of eligible voters. In 2026, on the highest turnout of the three elections, Civic Contract secured 49.9 percent of valid votes and 29.0 percent of the registered electorate.
Examination of the statistical data makes clear that the ruling party’s share of valid ballots has declined with each electoral cycle: 70.4, then 54.0, and finally 49.9 percent. Its absolute vote count exceeds the 2021 figure. At the same time, its share within the total registered electorate falls between the two earlier results: above 2021, but five points below 2018. The political mandate granted is legitimate. It is also much more limited than the seat count might suggest, and built on a fundamentally different distribution of voters than in 2018.
What the fourth observation showed
The pattern from 2021, 2023, and 2025 did not extend to the 2026 parliamentary election at the national level. It survived in three marzes. The relationship reversed in two. Across the rest of the country, the correlation between precinct turnout and ruling-party share is no longer there.
The single indicator to watch: whether Yerevan, Gegharkunik, and Syunik keep the pattern through the next municipal cycle. If they hold while the rest stays blue, a durable regional split has formed. If they lose it too, then 2018 to 2026 records a complete cycle. In December 2018, seven months into the new government, the same correlation across 2,010 precincts was -0.086, statistically indistinguishable from zero. It grew as the incumbency aged, reached -0.329 in the 2023 Yerevan council elections, and now stands at +0.012 nationally in 2026.
* 2026 results from the Central Election Commission of Armenia (elections.am), with 2,005 of 2,005 polling stations counted. 2018 and 2021 precinct-level data from published CEC xlsx files. Threshold tests computed against the legal denominator (valid party votes plus ballots with minor marking irregularities), not against valid party votes alone. Pearson correlation computed at the precinct level for Civic Contract vote share within each marz. Calculations and chart code available on GitHub.
References
[1] Electoral Code of the Republic of Armenia, threshold and mandate allocation provisions // National Assembly of Armenia — parliament.am
[2] National Assembly Elections, 7 June 2026 — precinct-level results // Central Election Commission of Armenia — elections.am/Elections/Parliamentary
[3] 2026 parliamentary election seat allocation // Radio Free Europe / Radio Liberty Armenian Service — azatutyun.am