The Growth Wave Stalled: What the New GDP Figures Reveal
Armenia’s economy stands before a familiar turning point. In a few weeks the government will report that GDP grew by 3.95% in the first quarter of 2026, and it will present the figure as proof that economic growth continues. The number is real. But it is the slowest first quarter in five years, and behind it lies the same illusion we have written about for three years running: growth that looks healthy on the surface while its foundations erode underneath. This time the shift is sharp. The financial sector, only a year ago the single fastest-growing part of our economy, has reversed from nearly 27% growth to a -13% contraction. The Iranian wave we described in April has begun to recede, and the banks are where it shows first.
The illusion of prosperity
If we look at the main GDP growth figure for the first quarter of 2026, there is nothing to worry about. Armenia is still growing, still outpacing most of the region, still comfortably in positive territory. But growth is a direction as much as a level, and the direction has been the same for three years. First-quarter growth was 12.4% in 2023, then 7.0% in 2024, then 5.4% in 2025, and now 3.95%. Each spring the economy comes in a little lower than the last.
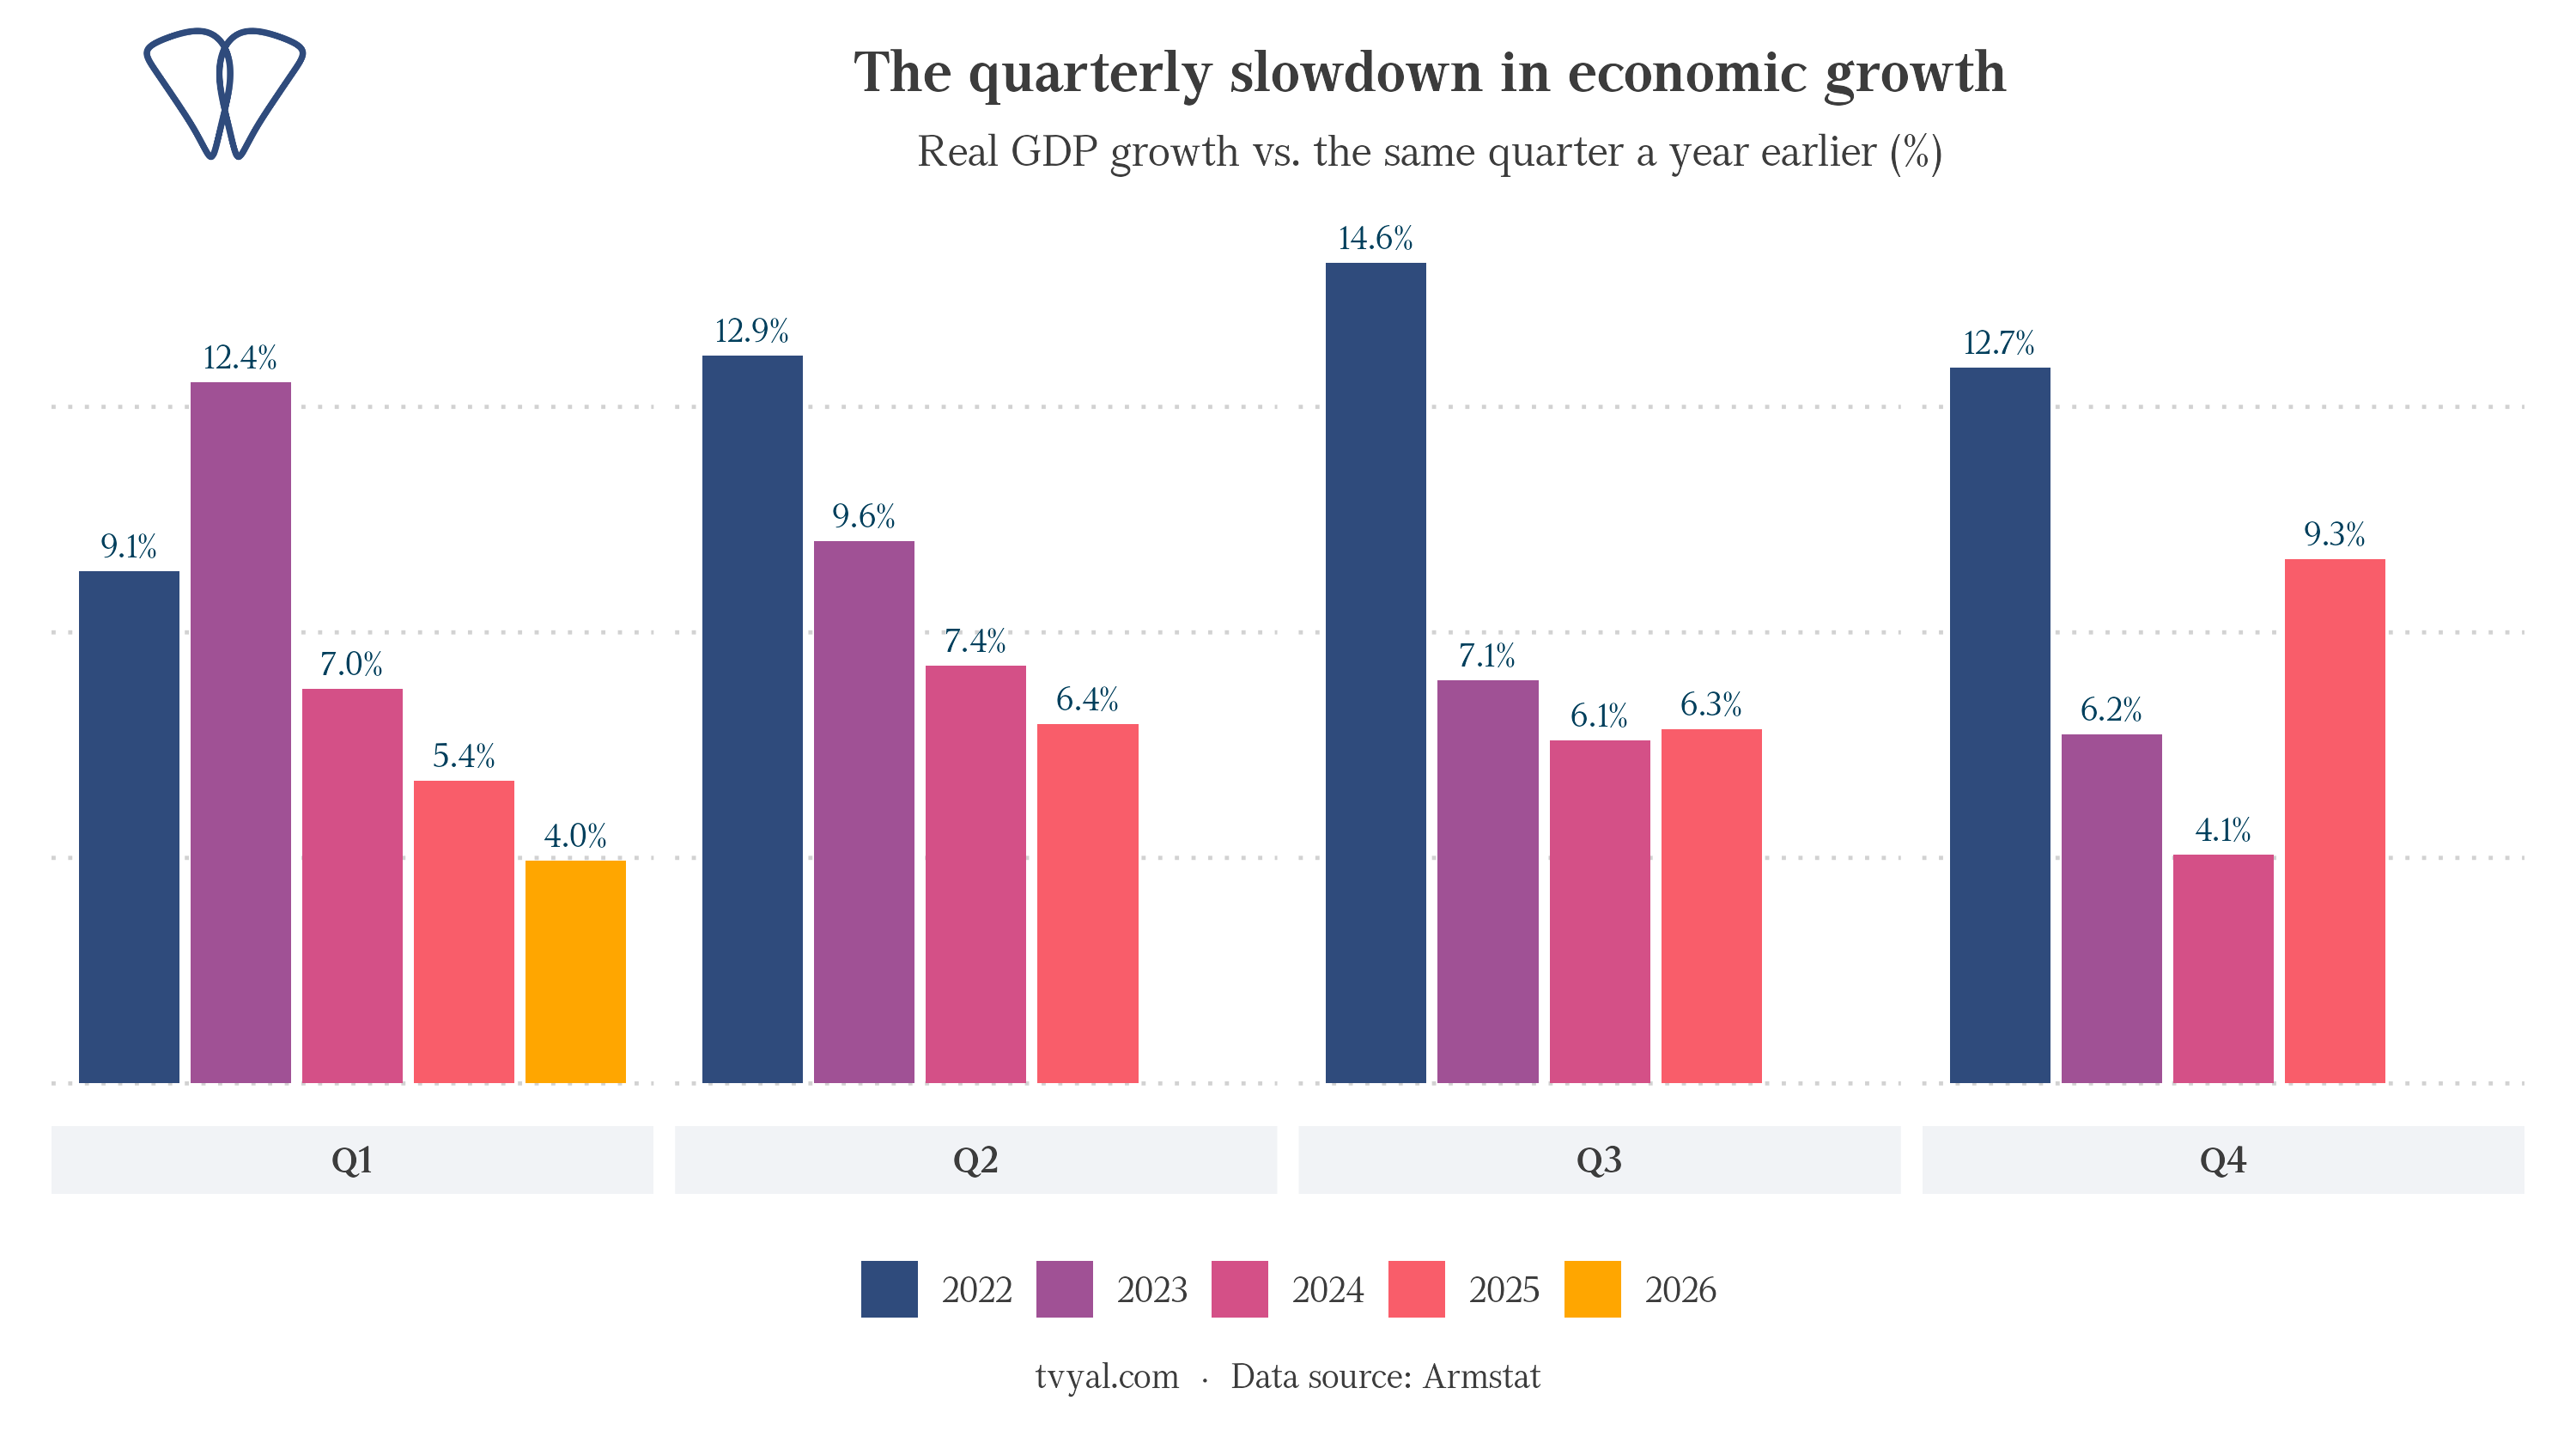
None of this surprises anyone who has been reading the data rather than the press releases. Armenia’s long-term average growth rate is around 4.5%, the pace it sustained through the 2010s, before the pandemic and the capital waves. Any system tends to return to its long-term average unless there are qualitative changes that ensure stable, long-term creation of value added. We have made this argument through every external wave of the past three years: the Russian capital of 2022, the gold re-export “industry” of 2023 and 2024, and the Iranian capital that lifted 2025 to a “miracle” 7.2%. Each one looked like prosperity while it lasted. Each one returned the economy to its mean once it faded. In April we wrote that the Q1 2026 figures, due in June, would be the first real test of whether the Iranian wave was holding. The test has come back, and the answer is written across the banking sector.
The economy’s engine reversed
Here is the part that rarely makes the headlines. Across almost every branch of the economy, the first quarter of 2026 was better than the first quarter of 2025. Mining swung from a -10% contraction to 35% growth. Construction accelerated from 14% to 21%. Transport went from a -13% contraction to 12% growth. Even manufacturing, which sat at -20% a year ago, clawed its way back to slightly positive. Engine after engine revved harder than the year before.
And yet the economy slowed. How does that happen?
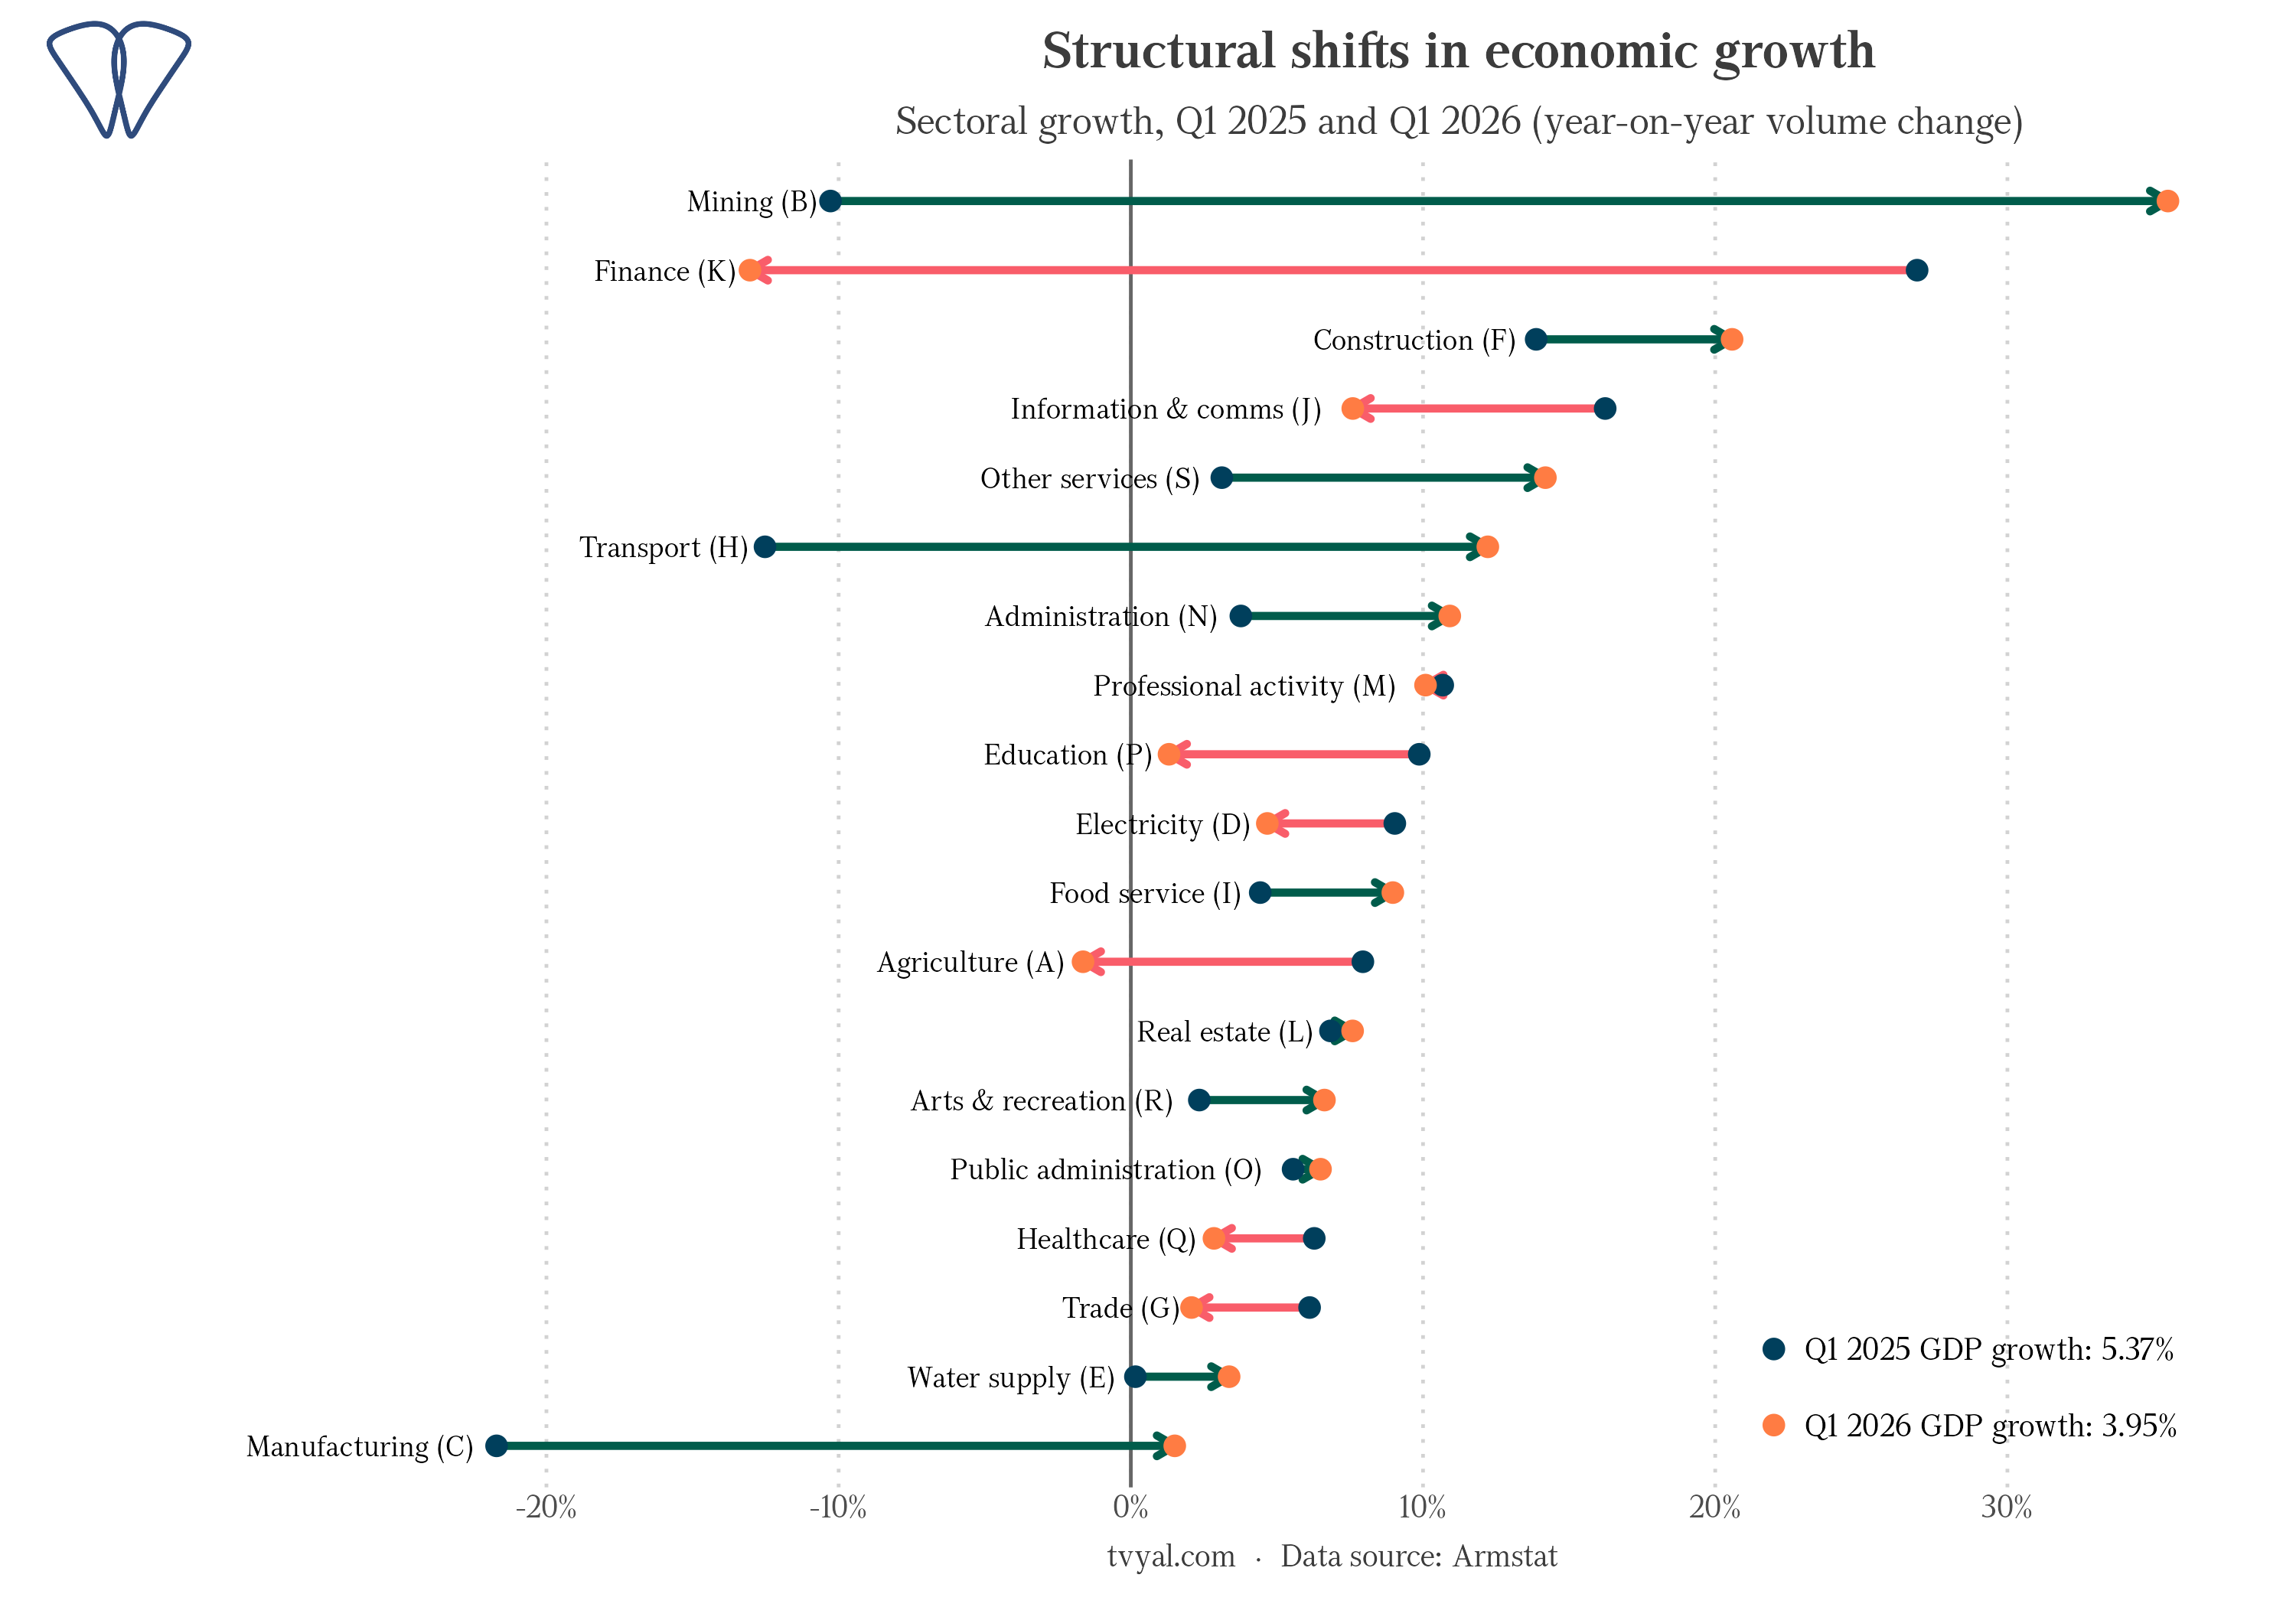
It happens when the one engine that stalls is the one doing the most work. A year ago finance was carrying the economy on its back, growing at nearly 27% as Iranian deposits and Iranian businesses routed money through our banks. This year that same sector is contracting by 13%. Picture a household where everyone got a raise except the one earner who was paying the mortgage. The family budget still looks busy, but the bill that mattered is no longer being covered.
This is what we meant by an absorber. When capital floods in, it lands first in the banking system, and financial services post spectacular growth. When the inflow slows, the absorber empties just as fast, and the sector posts the mirror image. The +27% of last year and the −13% of this year are not two separate stories. They are the same wave, seen on its way in and on its way out.
What is holding the number up
If finance is dragging, what is keeping the headline above zero? The contribution breakdown answers cleanly. Construction added 1.5 points to growth, the broad cluster of smaller services added another 1.1, and mining added 0.9. Finance contributed -0.9 on its own. Note that construction is itself largely financed by funds drawn from the banking system, so if finance keeps falling, construction is next in the chain. Strip away construction and mining, which together supplied around 60% of the quarter’s growth, and very little of the economy is left standing on its own legs.
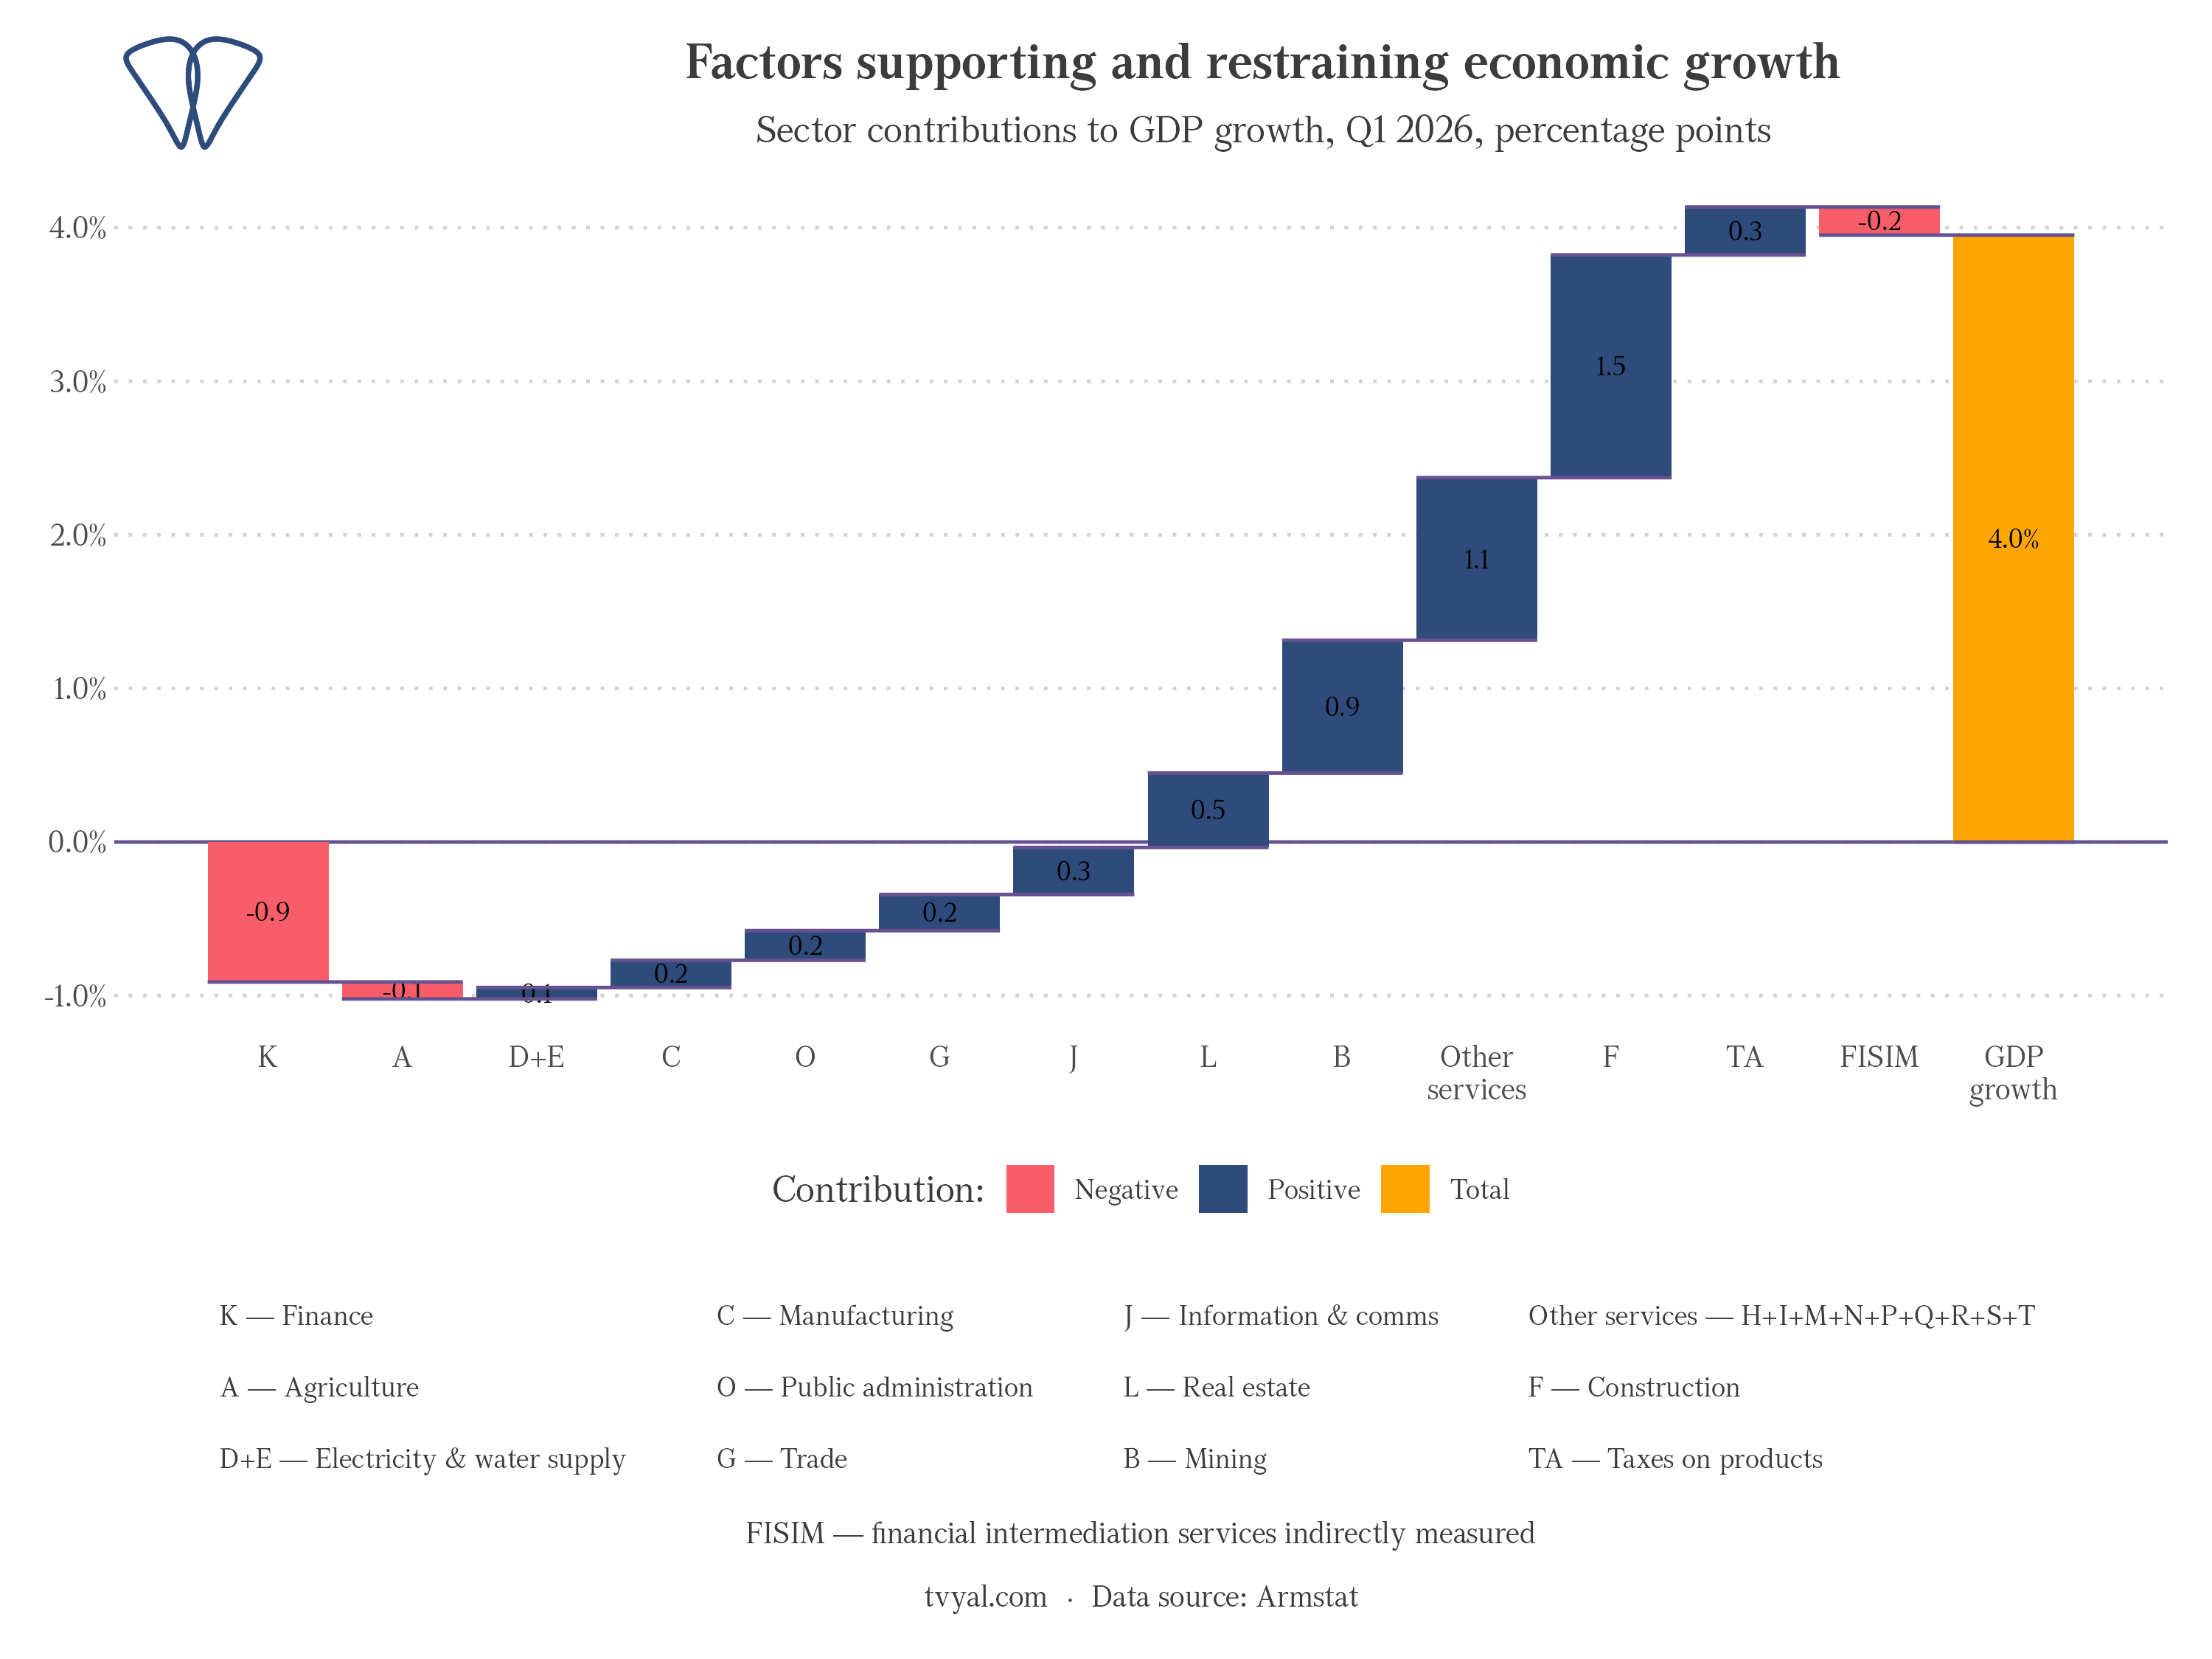
It is worth noting that this is the same kind of composition we have flagged before. Construction does not grow at 21% because Armenians suddenly need more buildings. It grows when capital that arrived from somewhere else looks for a durable place to sit, and chooses concrete. The same money that inflated the banks last year is being poured into foundations this year. It is the wave again, only now it has changed shape from a deposit into a building. Like the gold re-exports of past years, this is a temporary stimulus, and temporary stimuli cannot be considered guarantors of stable, long-term growth.
A growth figure is not a verdict on an economy. It is a snapshot of which engines happen to be running this quarter.
The disguised decline
Let’s stretch the picture back to 2020, so the structure is visible. The contributions to our quarterly growth swell through 2022 on the Russian shock, fade as that wave recedes, and swell again on the right edge as the Iranian capital arrives. Each bulge is somebody else’s crisis becoming our growth. And on the very last edge, the band that belongs to finance is thinning while construction widens, the unmistakable signature of money moving out of the banks and into fixed assets on its way through.
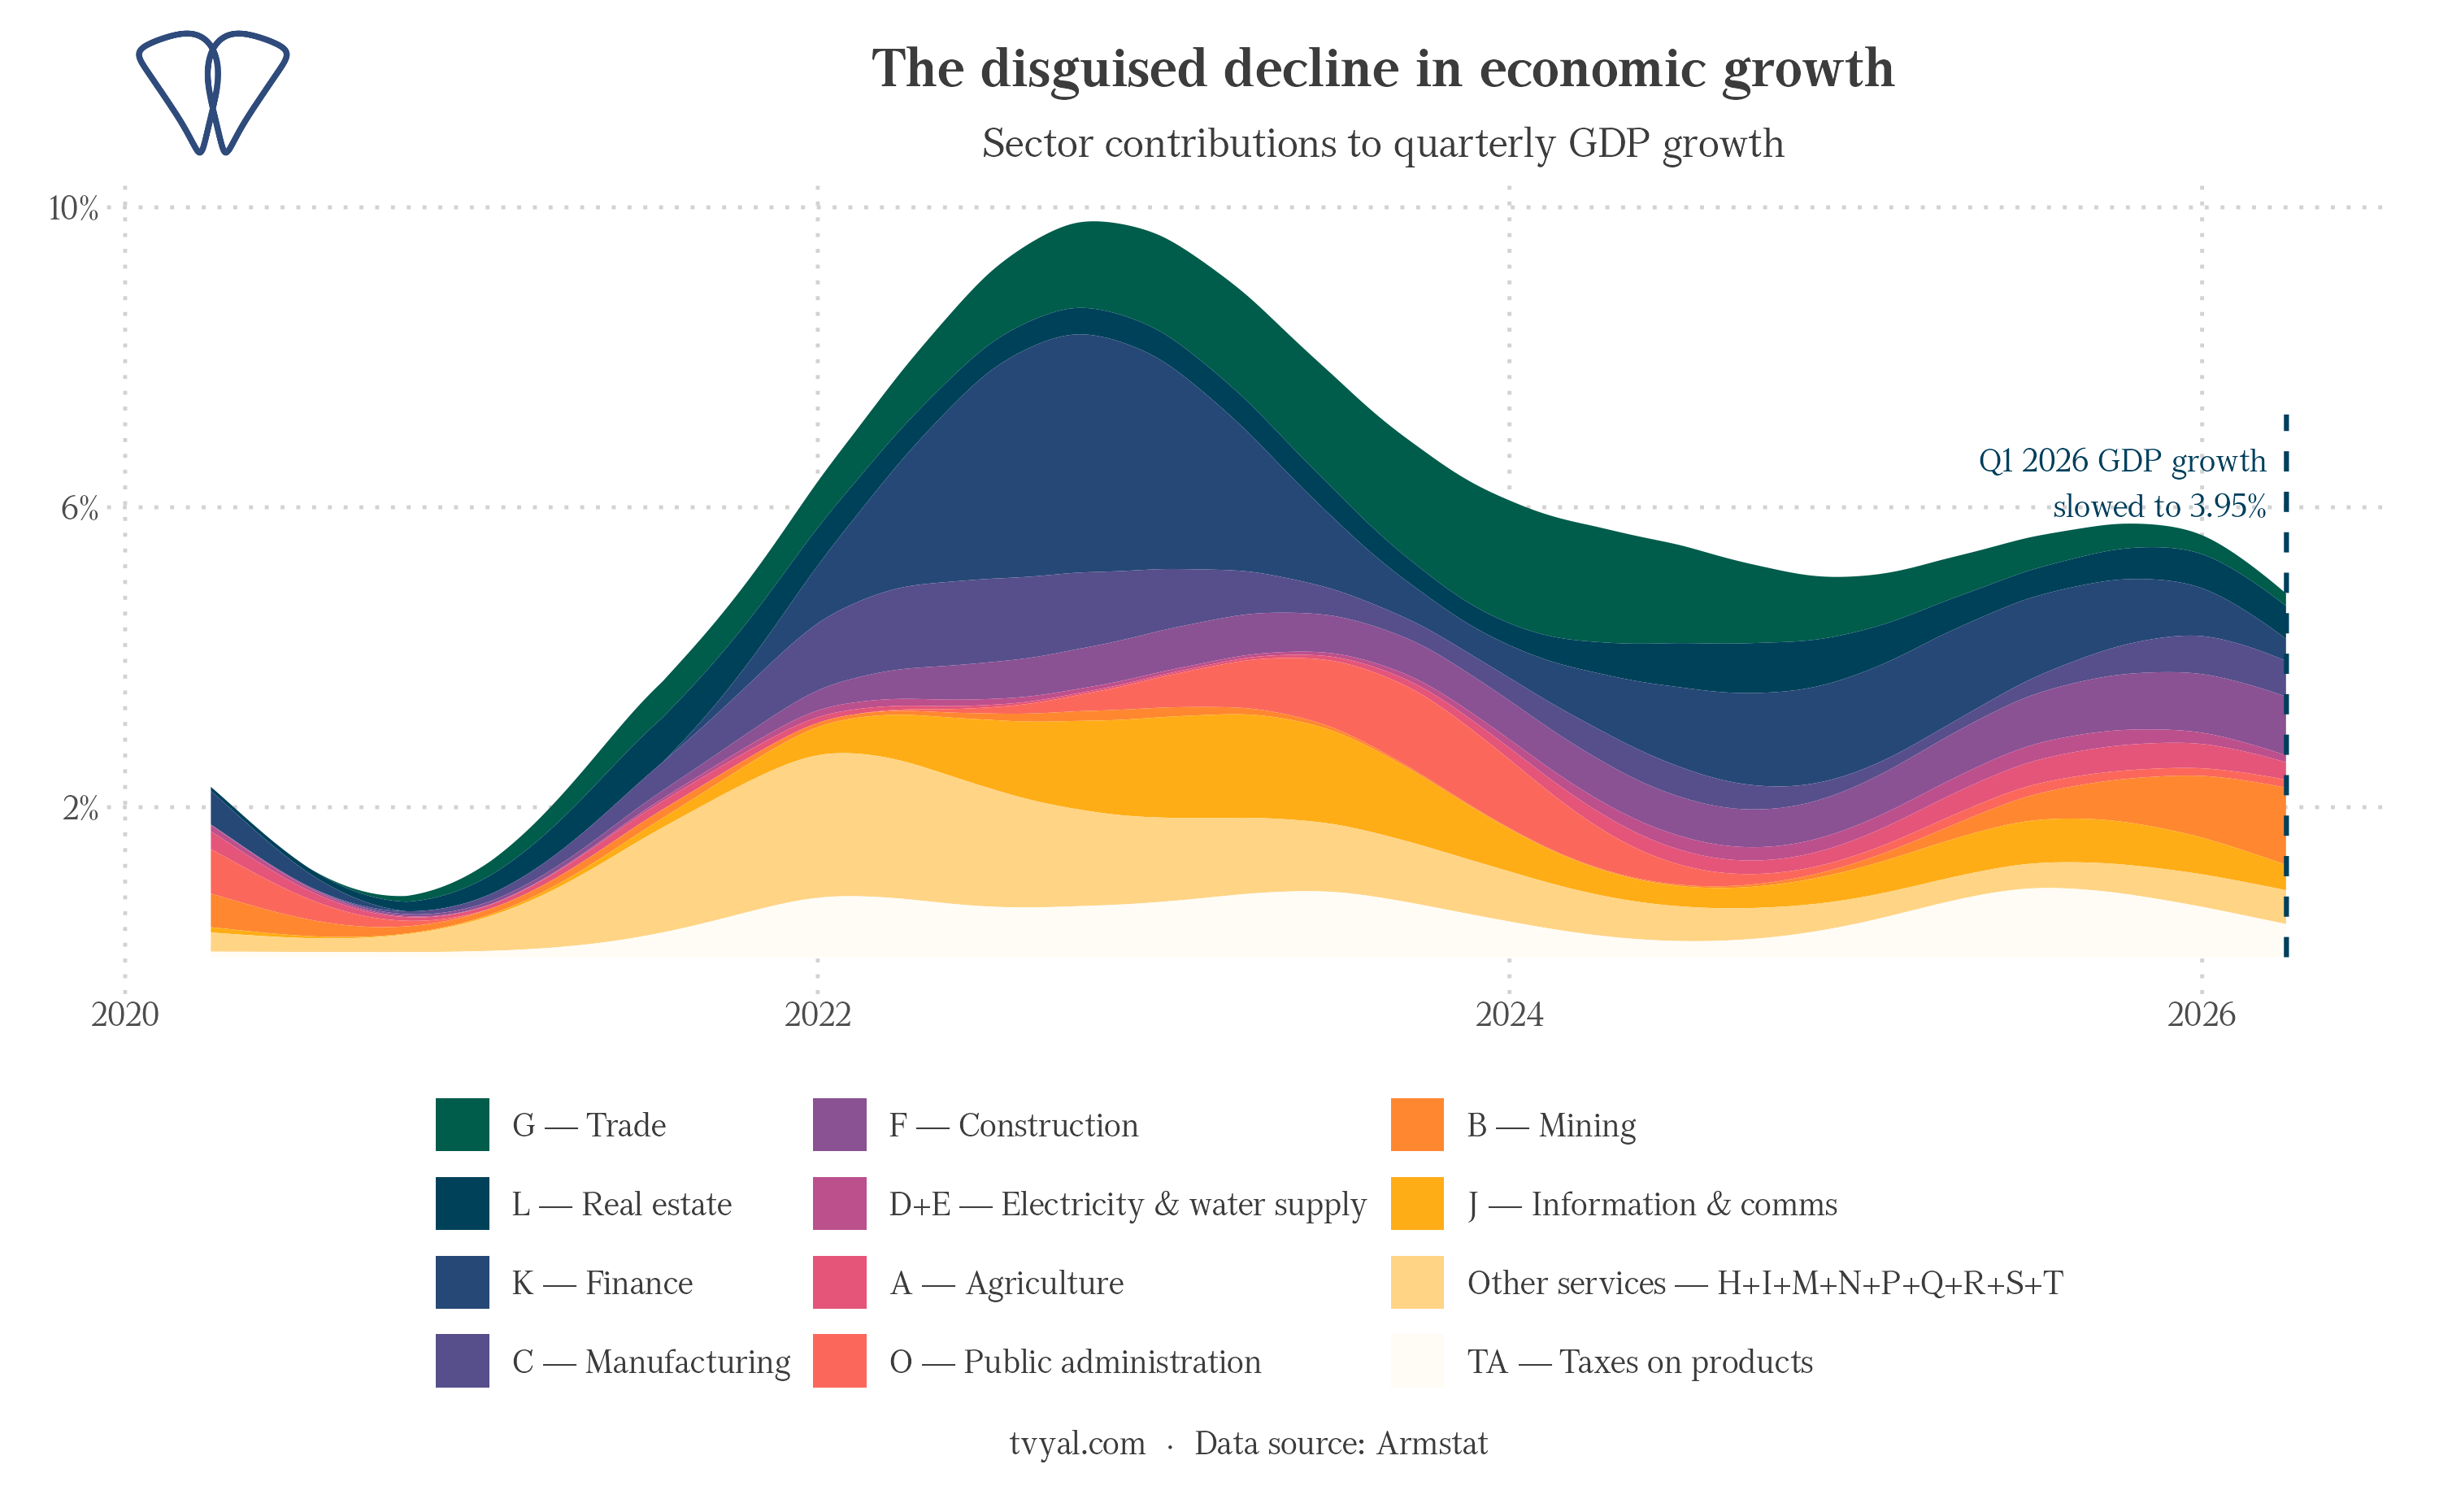
What is worrying here is not the 3.95% itself, which is a respectable number. It is what the number disguises. A headline reports the height of the water without telling you the tide is going out.
The indicator to watch is the same one we named in April: net foreign-currency inflows into the banking system, published monthly by the Central Bank. Finance went negative this quarter because those inflows are no longer arriving at last year’s pace, which is also why the dram has steadied against the dollar in recent months instead of strengthening. If they keep slowing, construction loses its fuel next, and the 4.5% mean stops being a floor and becomes a ceiling. Armenia has now run the same experiment twice, with Russian capital and then Iranian. Both times the question at the end is identical: what does this economy do when nobody next door is in crisis. Until we can answer that with value added of our own, we are still chasing the wave rather than building the shoreline.
* GDP data from Armstat national accounts (quarterly and annual series, volume indices used for growth and contribution calculations), downloaded directly from armstat.am. Sector contributions are computed from prior-period production weights. The 4.5% long-term average is Armenia’s mean annual real GDP growth across the 2010s (2010–2019), the post-crisis decade before the pandemic and the capital waves; including the shock years raises the figure, while starting the count at the 2009 crisis lowers it. Calculations and chart code available on GitHub.
References
[1] National Accounts, Gross Domestic Product by economic activity, quarterly // Statistical Committee of the Republic of Armenia (Armstat) — https://www.armstat.am/en/?nid=202
[2] The Iranian Wave: The Hidden Capital Behind Armenia’s 7.2% GDP // tvyal.com, April 2026 — https://www.tvyal.com/analysis/en/2026/2026-04-17
[3] Monetary survey and foreign-currency flows of the banking system, monthly // Central Bank of Armenia — https://www.cba.am/en/SitePages/statmonetaryfinancial.aspx