The Debt Doubled but the Number Fell: The Debt That Depends on the Exchange Rate
As of the end of 2020, the Armenian government debt amounted to 63.5% of GDP. By the end of 2025, it had already decreased to 47.2%. In the same five-year period, however, the debt in dollar terms increased from 7.5 billion to 14.0 billion. Both indicators are official and accurate.
How can the debt almost double when the government debt-to-GDP ratio is decreasing by 16 percentage points? The reason is not debt repayment. The main factors were the appreciation of the dram and the growth of nominal GDP. The reasons for the government’s continued borrowing have already been partially explained: an economy characterized by a current account deficit of $2.55 billion (as recorded in 2025) needs to finance this deficit with external funds. Therefore, when foreign investors do not buy enough local assets, the government is forced to raise new debt. This article examines the process of borrowing itself, its volume and currency structure. The analysis is based on our academic article on the sustainability of Armenia’s public debt, published in June in the scientific journal Alternative [1].
How much room is left
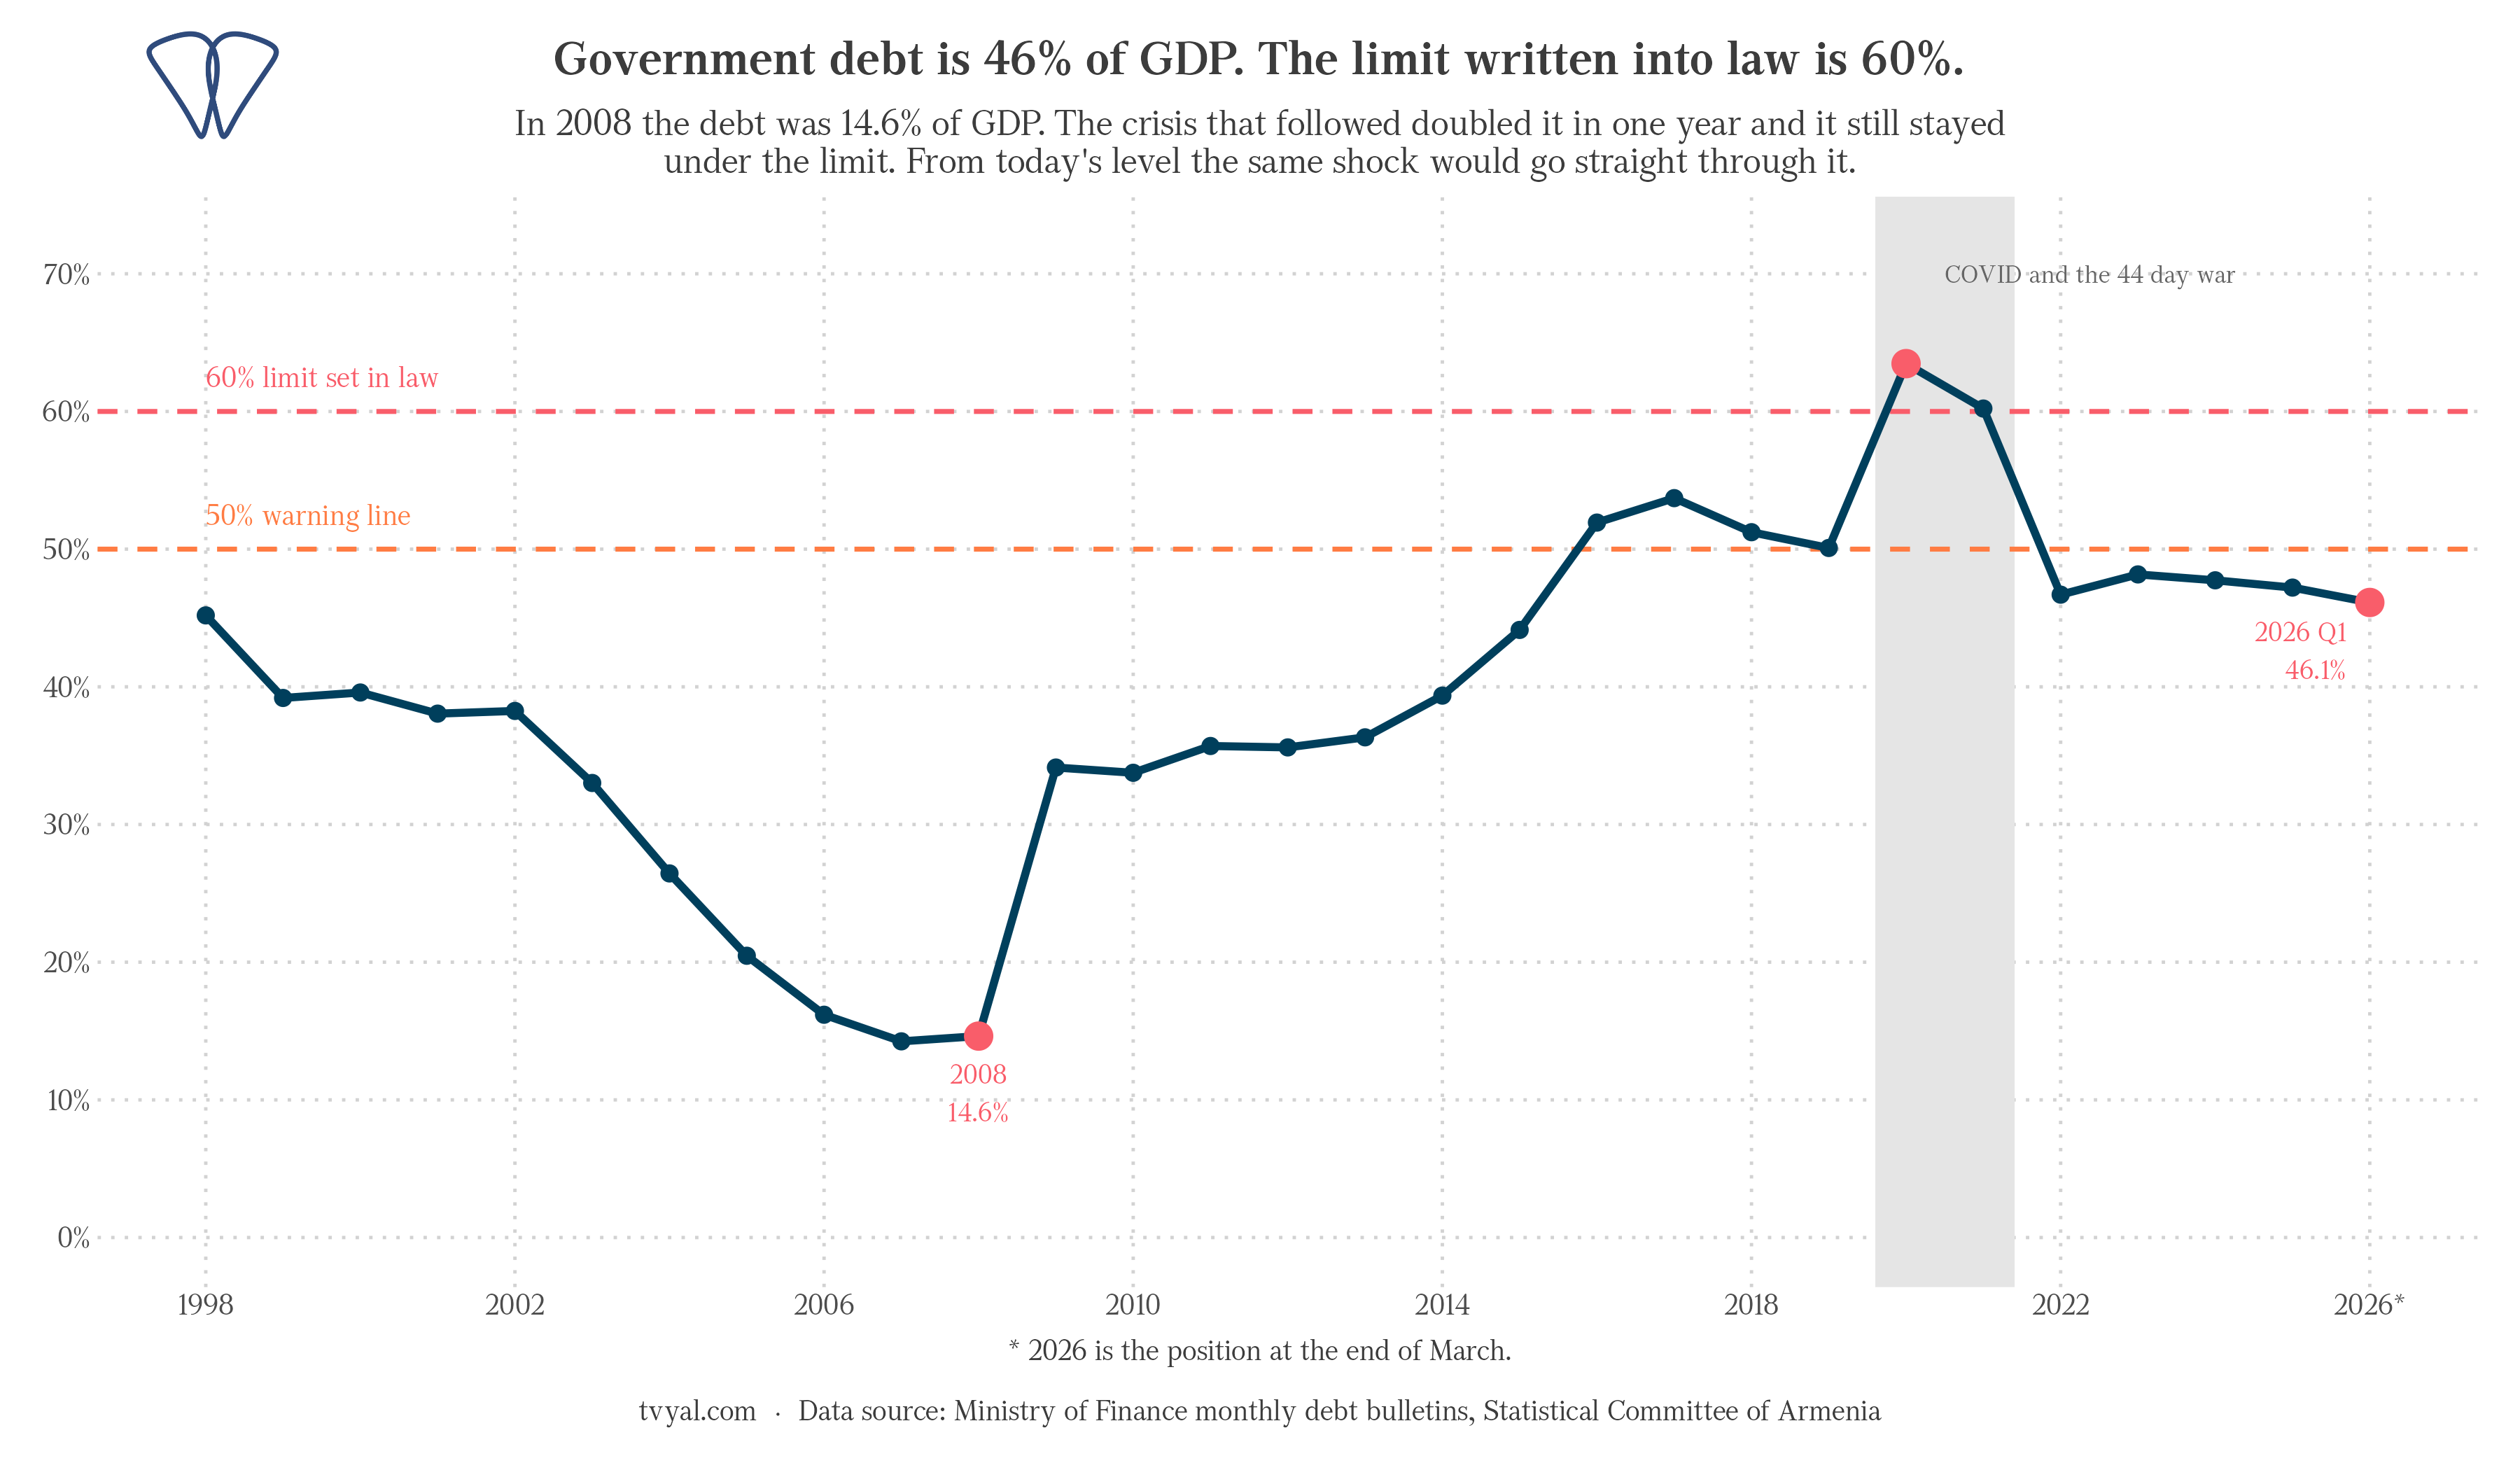
In 2008, the Armenian government debt amounted to 14.6% of GDP. At that time, there was a difference of more than 45 percentage points between the actual indicator and the maximum threshold of 60% set by law. As a result of the global financial crisis, in just one year, the ratio more than doubled, from 14.6% to 34.1%. Later, as a result of the pandemic and the war in 2020, the indicator completely exceeded the set threshold, reaching 63.5%. After that, the ratio decreased, and as of the first quarter of 2026, it was 46.1%.
An initial examination of the chart gives the impression of recovery, but as a measure of resources it gives a different picture. In 2008, Armenia was able to withstand the global financial crisis, as a result of which the debt ratio doubled, but still remained 26 percentage points below the maximum threshold. Currently, there are only 14 percentage points of room. In the event of a recurrence of similar shocks, the economy will no longer have the same flexibility.
It is necessary to highlight one methodological feature that somewhat changes the calculations. On January 8, 2026, the new Law “On State Debt” [2] entered into force. It removed the Central Bank’s obligations and government guarantees from the definition of debt, and instead included municipal debt. In addition, the basis for calculating the 60% maximum threshold has changed: it is now estimated as the ratio of government debt to GDP for the current year, instead of the previously used ratio of state debt to GDP for the previous year. The impact of the recalculation on the indicator used is not significant. The December 2025 indicator was adjusted from 47.2% to 46.7%; therefore, approximately half of the 1.1 percentage point decrease recorded in the first quarter of 2026 is due to the legislative change, and the other half is due to the net debt reduction. This circumstance is important because a direct comparison of published statistics refers to the legal definition, not to the actual dynamics of the debt itself.
The real direction of borrowing
The amount of debt in dram terms fluctuates with changes in the exchange rate, which makes it difficult to assess how much is real borrowing and how much is purely the result of revaluation. In dollar terms the effect of the exchange rate is neutralized, and the indicator reflects the true picture of borrowing.
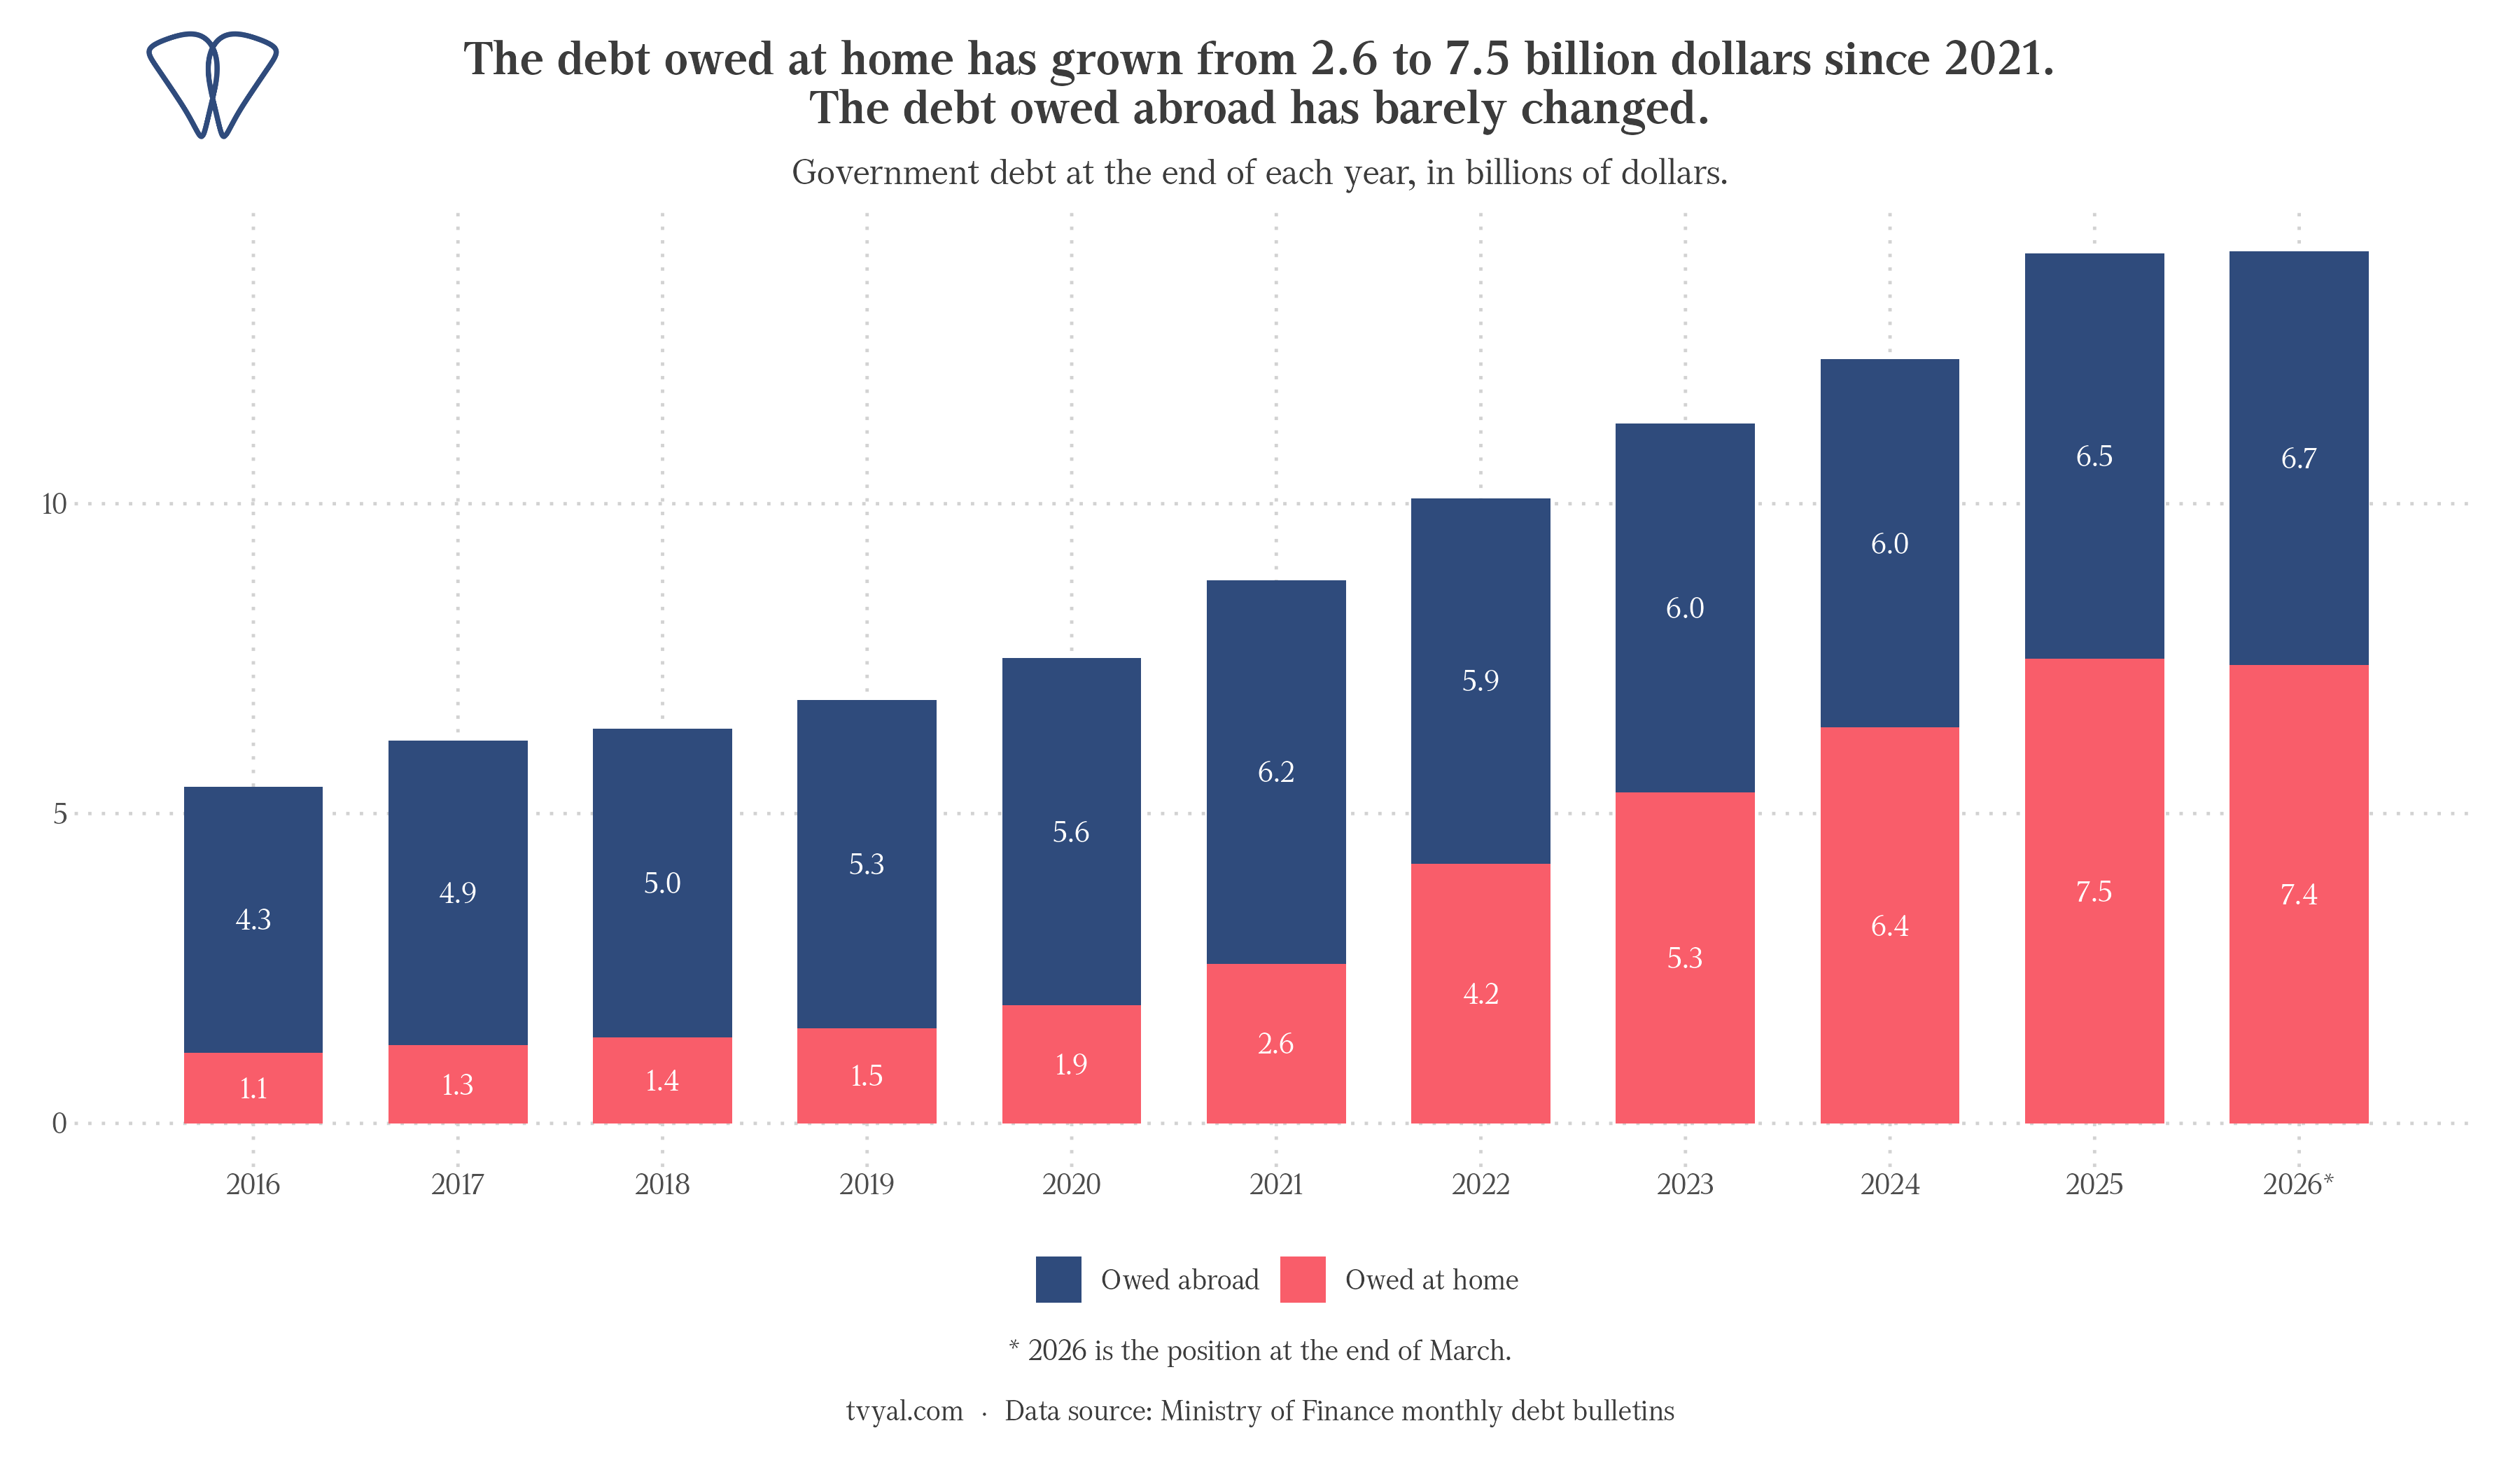
The volume of external debt has not changed significantly since 2021. In 2021, it amounted to $6.2 billion, and at the end of 2025, it was $6.5 billion. Over the same four years, domestic debt has almost tripled, from $2.6 billion to $7.5 billion. Compared to 2016, external debt has increased by about one and a half times, while domestic debt has increased by almost seven times.
In essence, the government has continued borrowing on a large scale. It has simply replaced external sources with domestic sources. This is often presented as a positive result, which is somewhat justified: servicing dram debt does not become more expensive in the event of a depreciation of the exchange rate. However, systemic risks have not disappeared, but have simply been transformed. As dram debt matures, it is reallocated to the limited domestic banking and pension systems. We will address servicing costs and repayment schedules in the second part of this analysis, which will be published in one of the next issues.
The real reasons for the decline in the ratio
If the debt has been continuously increasing, what is the reason for the decline in the ratio? The ratio is made up of two variables, and in this case, the role of the denominator (GDP) was decisive.
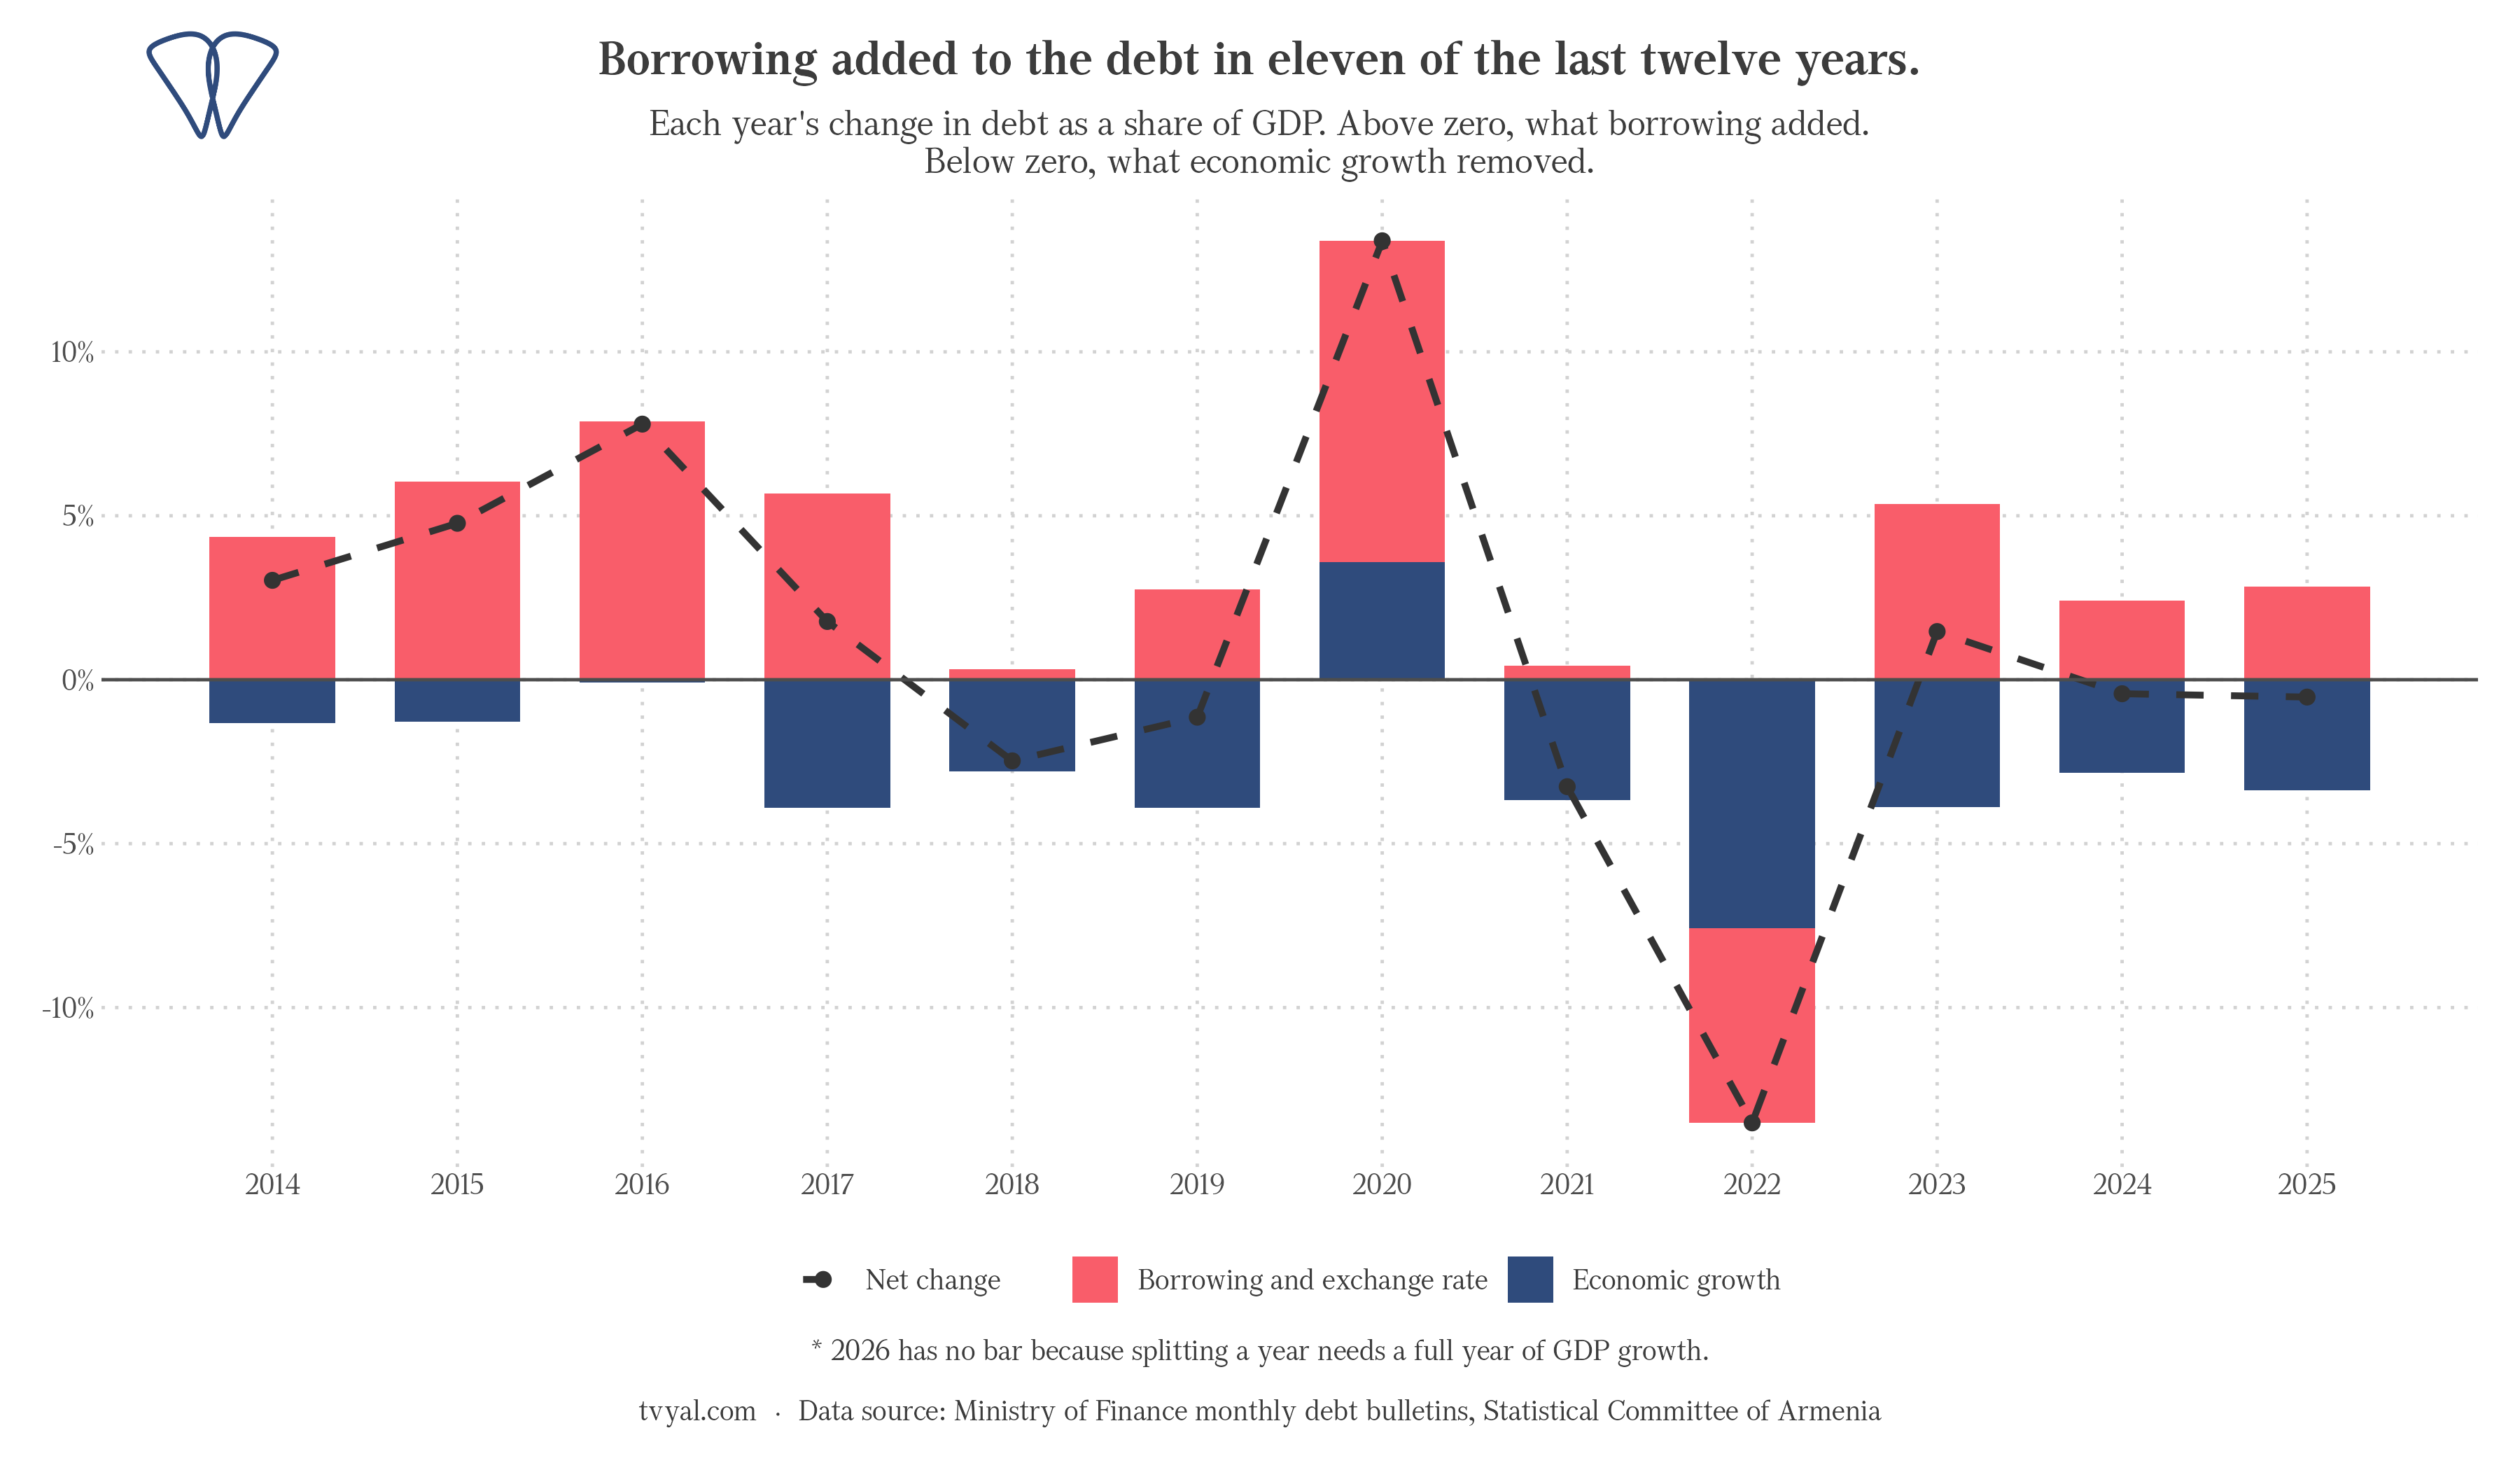
The chart separates the changes for each year into increases driven by borrowing and revaluation, as well as decreases driven by economic growth. In eleven of the previous twelve years, new borrowing contributed to the increase in the ratio. The only exception was 2022, which, however, was not the result of debt repayment. During that period, the dram appreciated sharply as a result of Russian capital inflows, and the dram equivalent of external debt decreased.
Since 2023 the two have counterbalanced each other. Economic growth reduces the ratio by an average of 3.4 percentage points per year, while borrowing increases it by an average of 3.5 percentage points. The net shift is close to zero, and the illusion of stability is formed solely by these two factors compensating each other.
The economic logic of the process is simple: suppose a household has a loan obligation of $10,000. As incomes increase and the exchange rate fluctuates favorably, the monthly loan service cost in drams decreases. On paper the debt-to-income ratio decreases, but no actual repayment has been made. The base loan obligation remains at $10,000, and the improvement in the situation is due to factors independent of the household.
The improvement in the ratio was largely due to the appreciation of the dram and economic growth. During the same period, however, the nominal volume of debt increased from $7.5 billion to $14 billion.
This circumstance also explains the discrepancy that has existed in public discussions for years. Every fall, the Ministry of Finance presents forecasts on the state debt, which are widely covered, as they have a negative trend. These forecasts are mainly discussed, but the lower indicators published at the end of the year, which are affected by the strengthening of the dram, remain in the shadows. These forecasts have always been high. In October 2025, when there were two months left until the end of the year, the minister announced in parliament that the ratio for 2025 would be 50.7% [3]. In fact, the year closed at 47.3% [4]. The reason is that the ministry carries out budgeting based on conservative exchange rate and nominal growth scenarios. Later, the dram appreciates; nominal GDP grows faster than planned. In essence, factors that present the decrease in the ratio in a positive light also lead to overestimation of forecasts.
Systemic vulnerability
Since the ratio is highly dependent on the exchange rate, the impact of its fluctuations needs to be assessed. In the chart below, the debt position as of December 2025 is reassessed by comparing exchange rate levels with real shock scenarios previously observed in the Armenian economy.
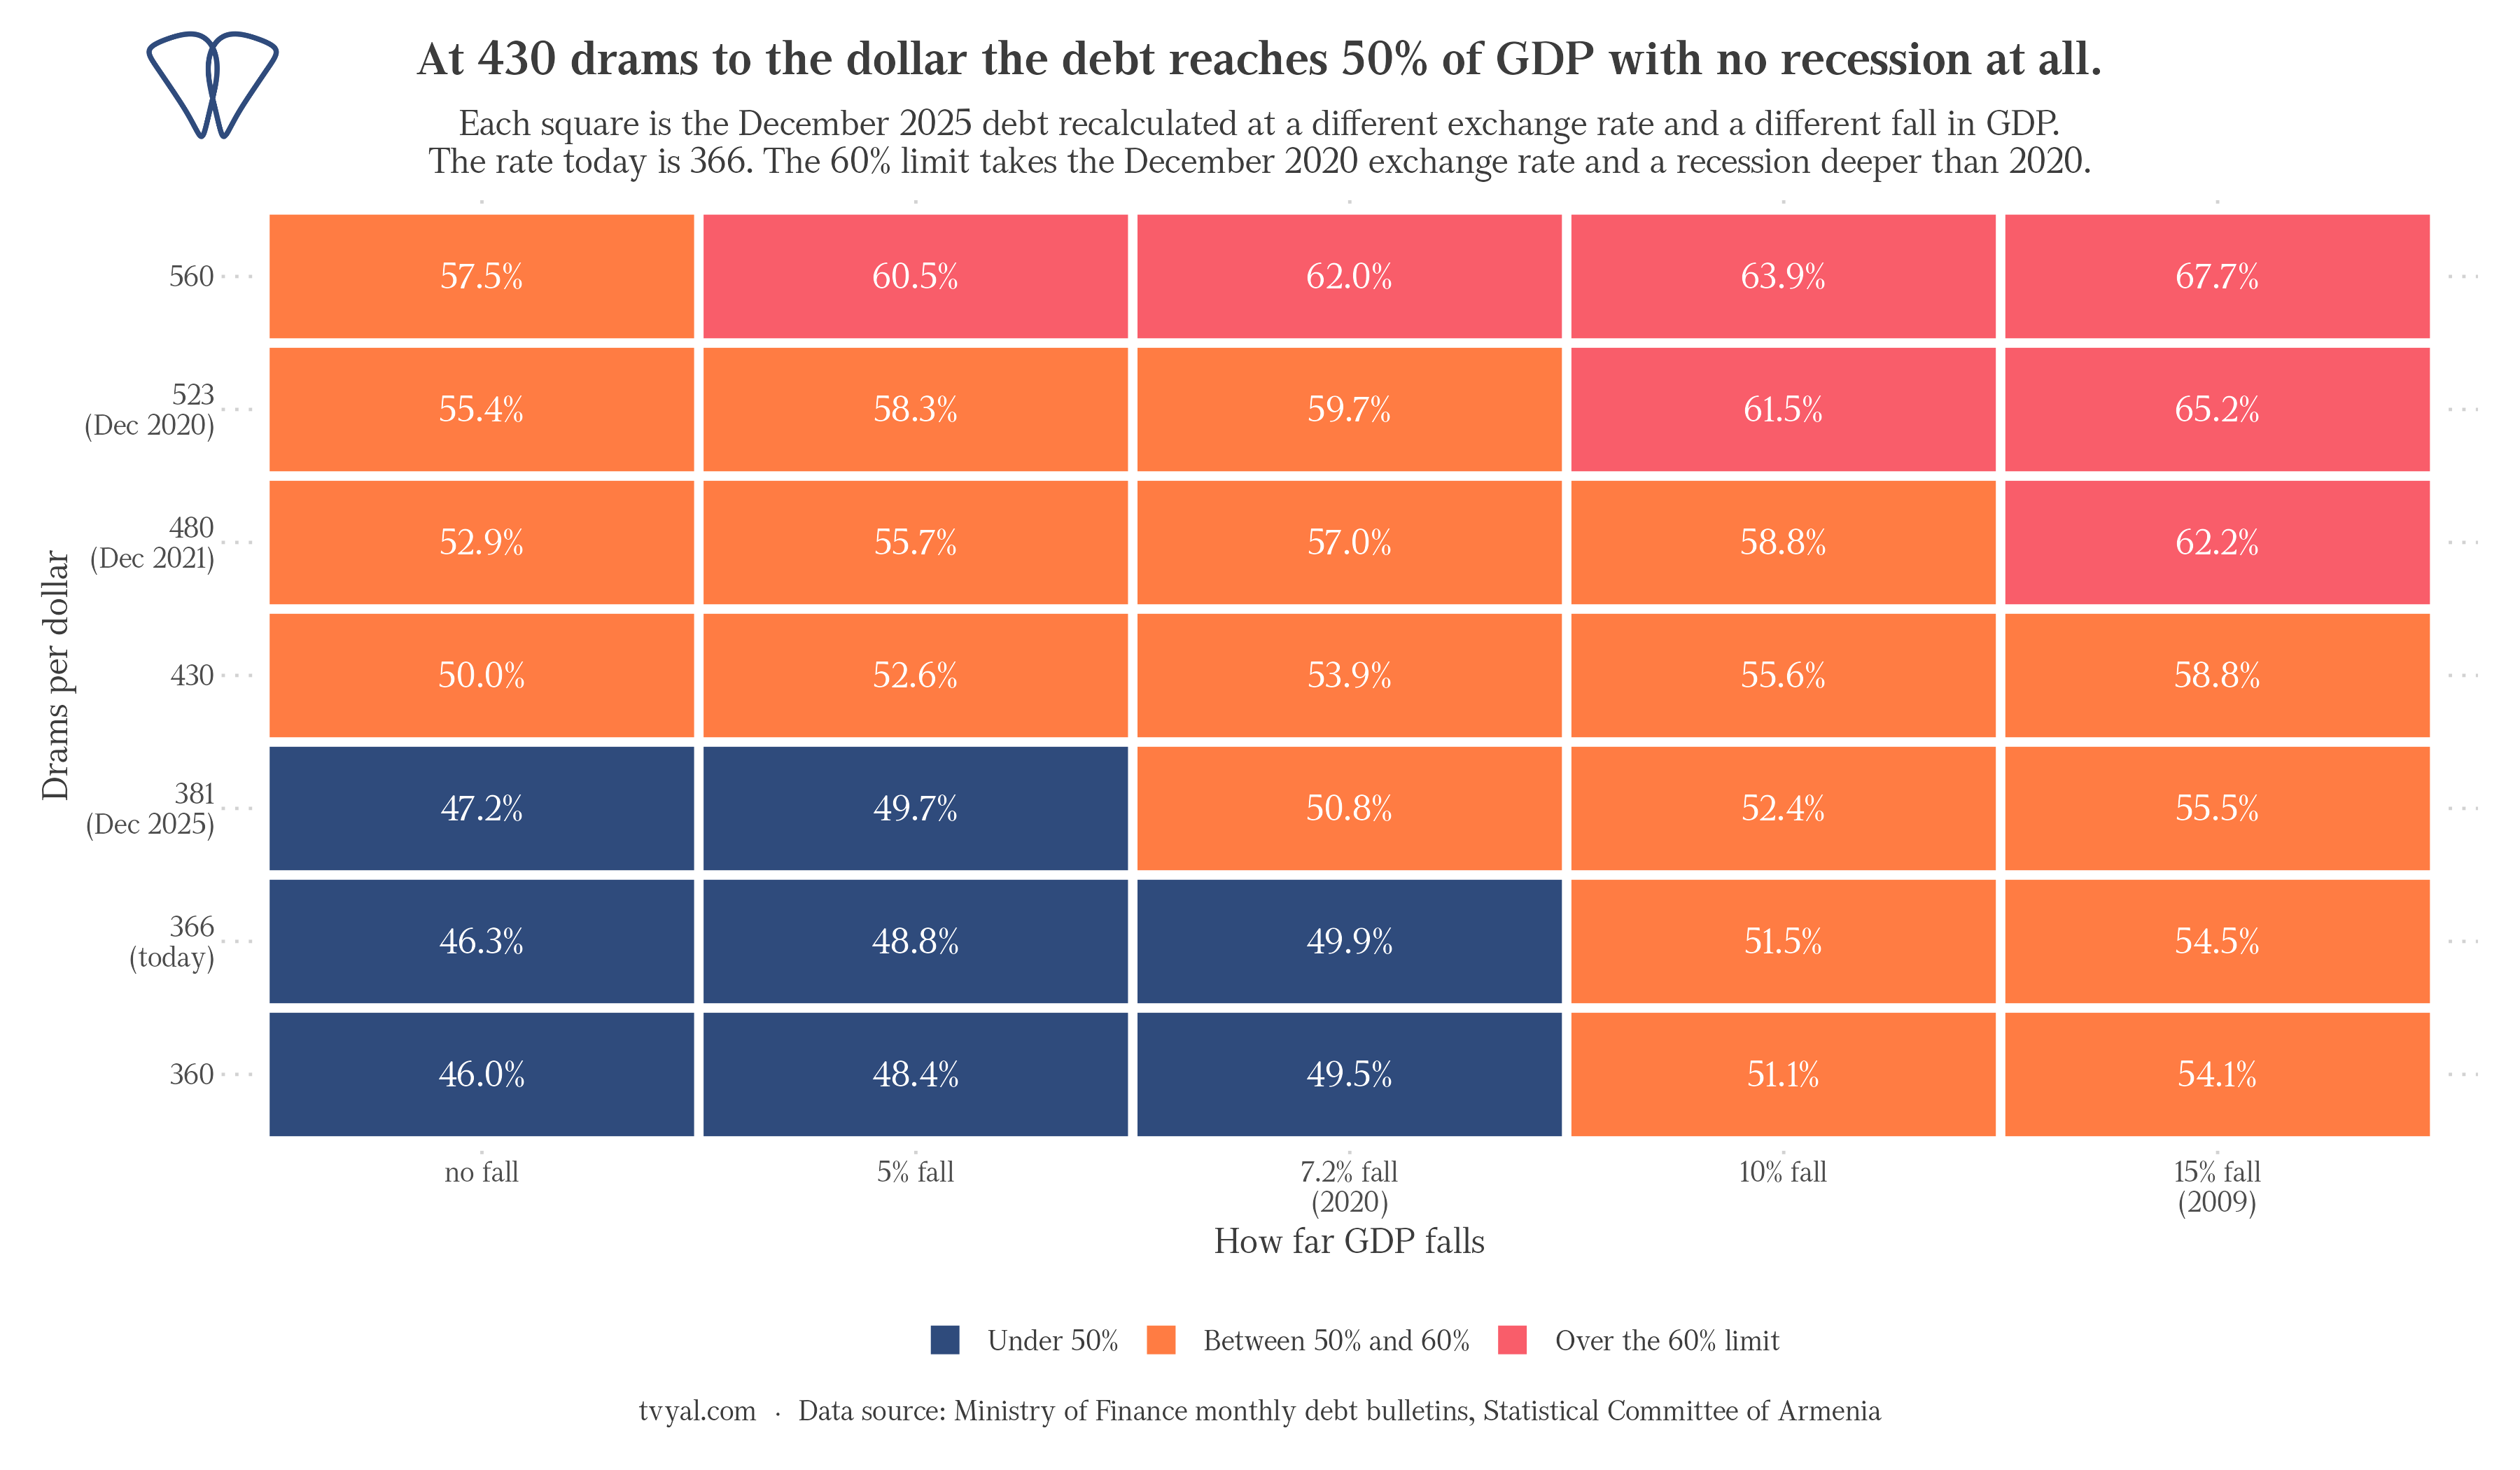
A look at the statistics shows that the probability of reaching the 60% threshold is still low. Reaching it would need a combination of the year-end 2020 exchange rate and a deeper recession than 2020, or of the year-end 2021 exchange rate and an economic downturn on the scale of 2009. This is a positive indicator that should be highlighted just as much as the potential risks.
However, the situation is different in the case of the 50% threshold. Crossing this threshold activates the deficit restrictions provided for in the Law “On the Budget System”. Moreover, in the event of a return to the dram exchange rate of 430 to the dollar, revaluation alone will cross this threshold, without any economic downturn. The last time the dram exchange rate was above 430 was on June 8, 2022; therefore, it is not an abstract scenario.
Each dram change in the exchange rate changes the ratio by about 0.058 percentage points. The appreciation of the dram from its December position to the current level of 366 leads to a decrease of 0.9 percentage points, and reaching 360 (which is considered a minimum threshold) leads to a decrease of 1.2 percentage points. In the opposite direction, the year-end exchange rate of 480 in 2021 increases the ratio by 5.7 percentage points, and the 2020 exchange rate of 523 by 8.2 percentage points. In fact, the appreciation of the dram is able to reduce the ratio by another percentage point, while devaluation can increase it by five to six points. This risk must be clearly assessed, since Armenia has a history of exchange rate crises, in particular the cases of 2008 and 2014.
Assessment of current trends
The logic of the above processes has been clearly demonstrated in the statistics of the last six months.
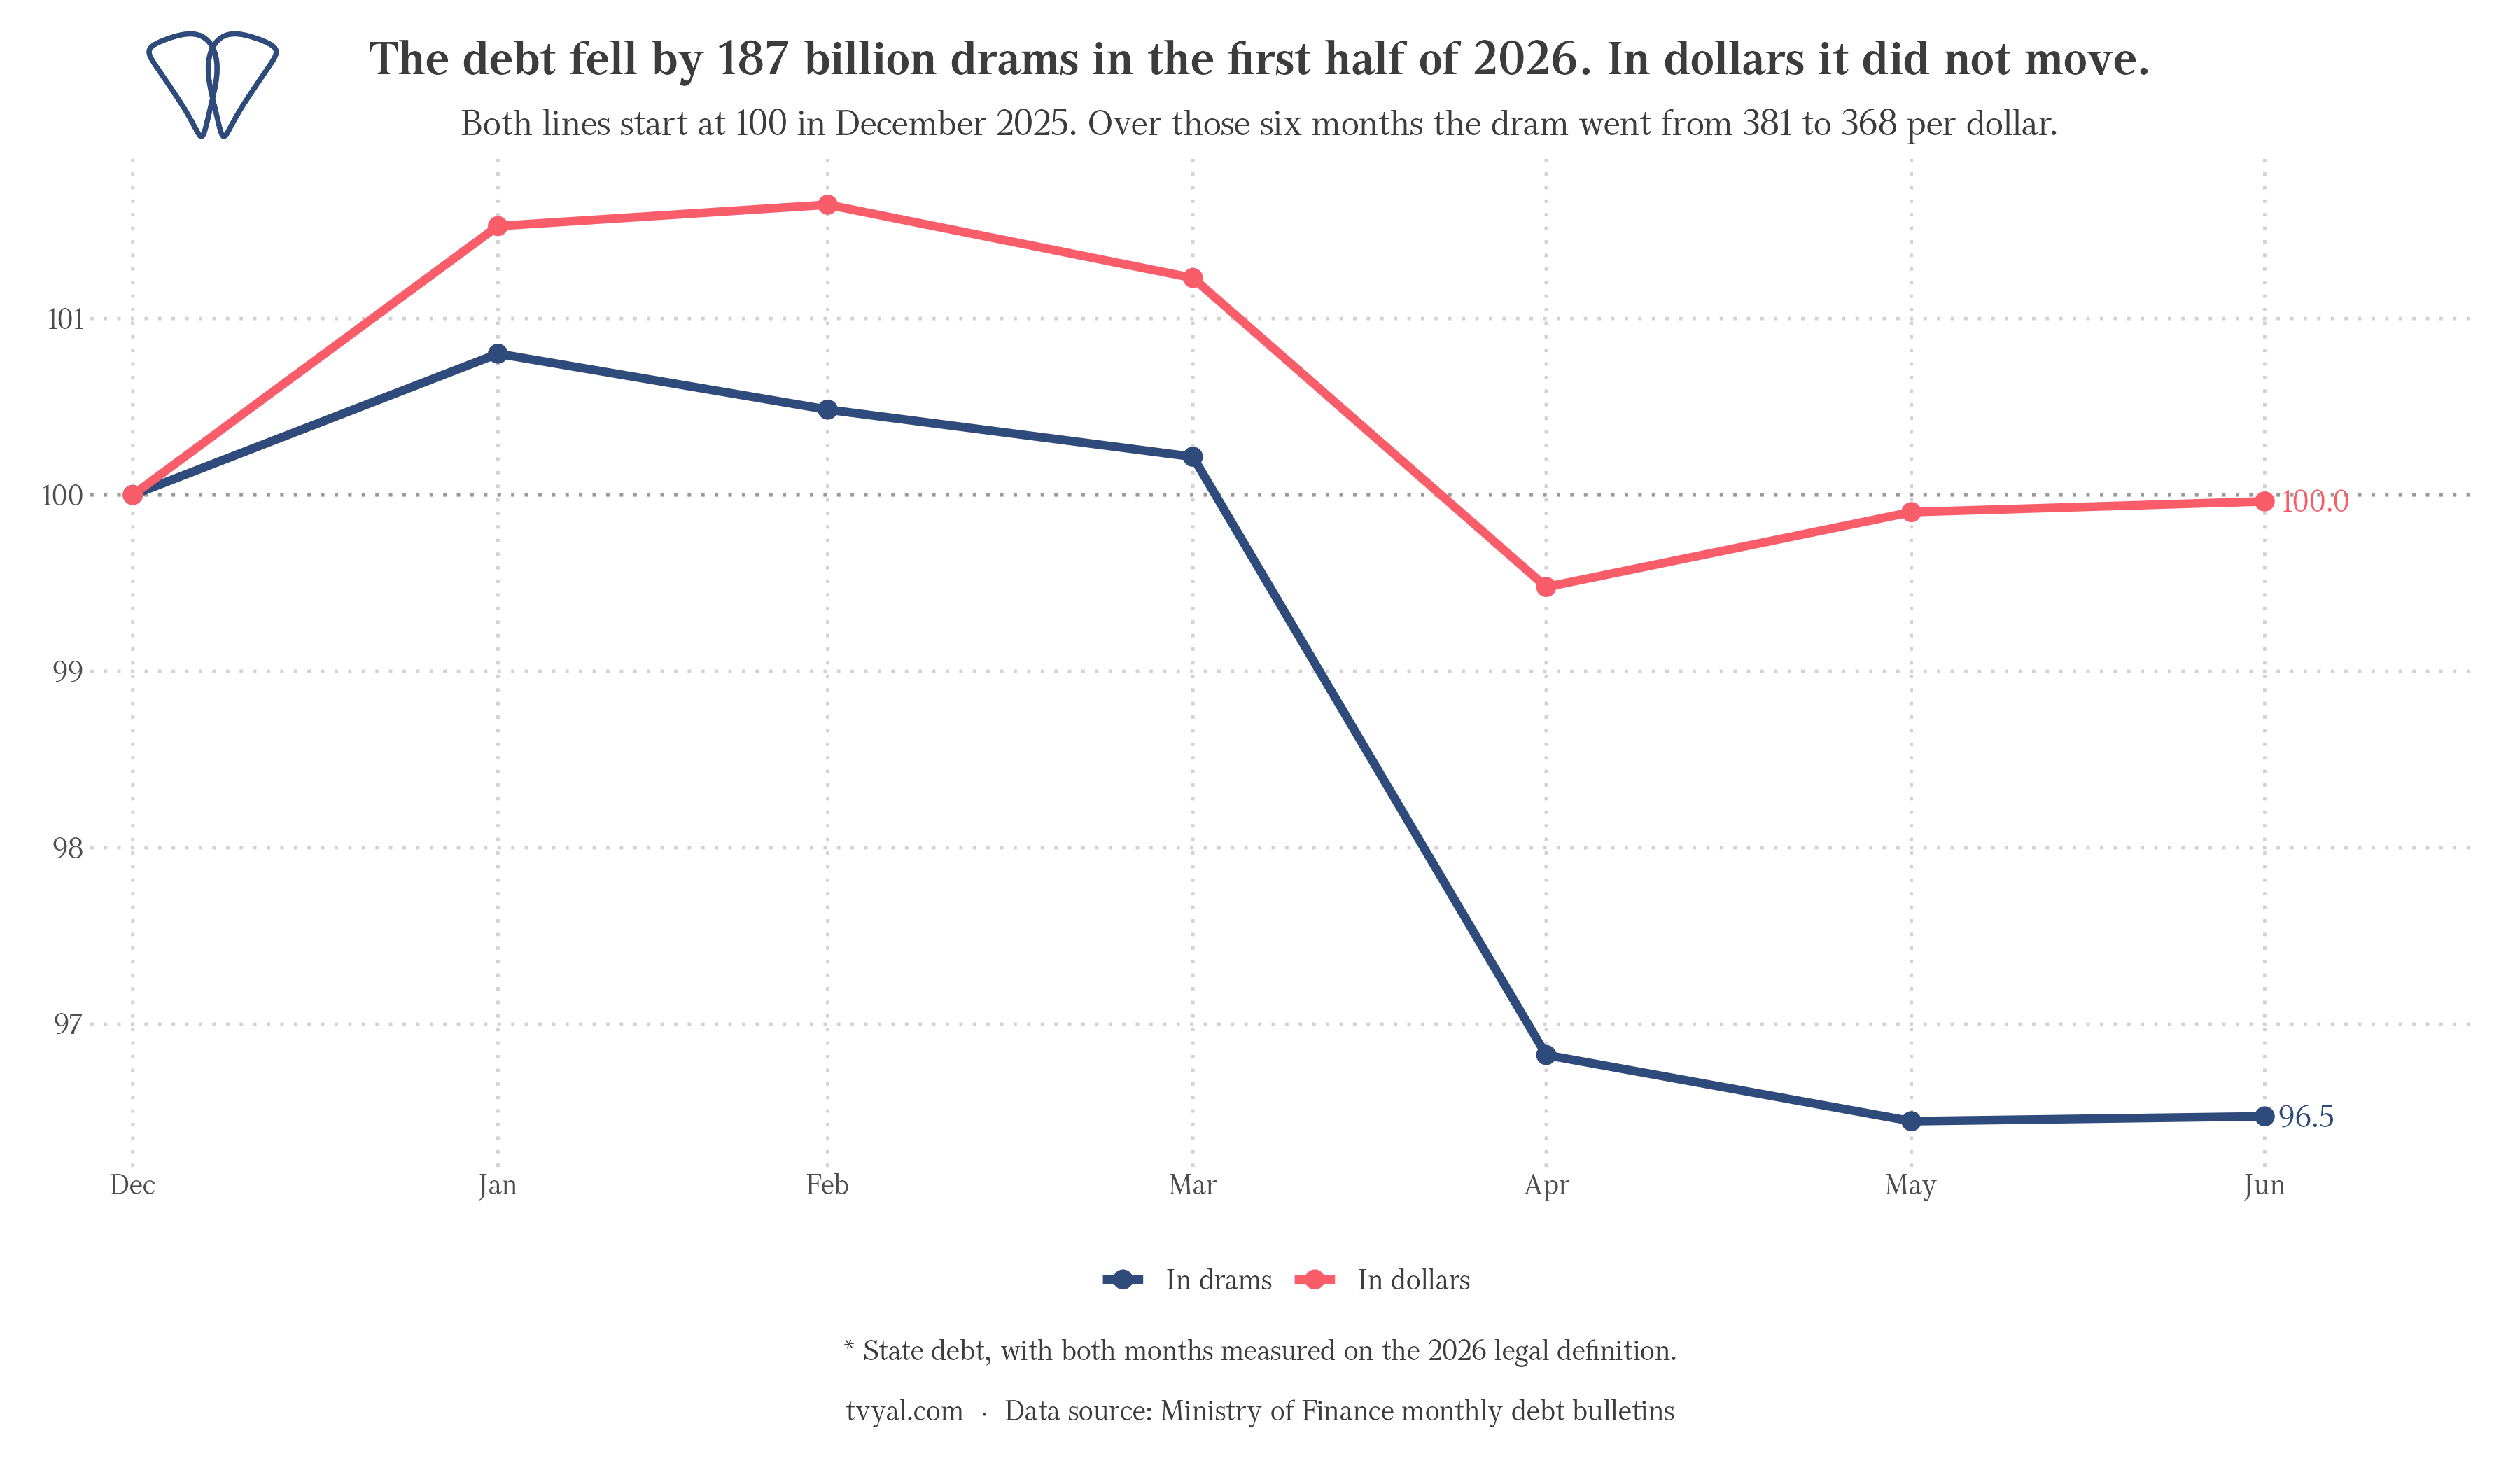
Between December 2025 and June 2026 (using the same legal definition), Armenia’s debt decreased by 187 billion drams, or 3.5%. Over the same six months, the debt in dollar terms decreased by only five million dollars, a statistically insignificant deviation given the total volume of 13.9 billion. No actual repayments were made. The dram’s exchange rate against the dollar fell from 381 to 368, and the entire change was due solely to foreign exchange fluctuations.
When analyzed on a twelve-month basis, the picture is the opposite. From March 2025 to March 2026, government debt increased by 193 billion drams (3.8% increase), and in dollar terms by 999 million dollars (7.6% increase). The ratio remained almost unchanged during the year. The debt increased by almost one billion dollars, but this fact was not clearly reflected in the main published indicators.
The government’s policy documents also reflect this trend. The ministry’s 2026 borrowing plan projects that the government’s debt-to-GDP ratio will be 52.9% by the end of the year [5], and in the medium term (2027 and 2028) it will reach 54% [3]. The stated goal is to eventually reduce the ratio to below 45% [6]. Any official figure above 50% is a forecast, while the latest actual value is 47.2%. However, the ministry itself expects the ratio to grow, while still planning on a stable exchange rate.
The key indicator of macroeconomic assessment is the debt in dollar terms, not the ratio. At the end of 2025, it amounted to $14.0 billion, and at the end of the first quarter of 2026, it was $14.1 billion. This absolute indicator is free from the impact of a favorable year of dram appreciation or nominal growth. The real growth of debt will stop only when the growth of this absolute number stops. Until then, the decline in the ratio indicates only a change in the denominator (GDP).
In the next analysis, we will look at the same debt from a different perspective: its servicing costs, repayment schedule, and creditor structure. The Ministry of Finance publishes monthly debt management indicators based on its own set of benchmarks, one of which shows that Armenia has been off target since August 2025.
On the debt-financed external gap: “The Guests Left, the Costs Stayed”. On the economic growth that contributed to the decline in the ratio: “The Growth Wave Stalled” and “The Iranian Wave”. On the impact of the exchange rate: “Dollar Near a 22-Year Low”.
* The data are based on the monthly public debt bulletins of the Ministry of Finance of the Republic of Armenia [7] (December 2016 to June 2026) and the nominal GDP indicators of the National Accounts of the Statistical Committee. The debt/GDP ratio was calculated by the author. The data for 1998–2015 were based on the official ratios published by the Ministry. The focus of the analysis is government debt, to which the 60% threshold requirement has been applied since January 8, 2026. The source code and database of the charts are available on the GitHub platform.
References
[1] Tavadyan A., Israelyan Y. (2026). Public Debt Sustainability in Armenia: Fiscal Thresholds, Decomposition, and Vulnerability to Shocks (1998-2025) // Alternative, ISSN 1829-2828, 2026. June 30, p. 87 – DOI 10.55528/18292828-2026.2-87
[2] RA Law “On State Debt”, in force since January 8, 2026 // Legal Information System of the Republic of Armenia – arlis.am
[3] Armenia’s public debt projected to hit 54% of GDP in the medium term // Caspian Post, October 27, 2025 – caspianpost.com
[4] Armenia’s public debt/GDP ratio in 2025 was 47.3% // ArmBanks, March 23, 2026 – armbanks.am
[5] Annual Borrowing Program for 2026, Section 5: “Government Debt at the End of 2026”, page 12 // Ministry of Finance of the Republic of Armenia – minfin.am
[6] The Armenian authorities plan to reduce the state debt to below 45% of GDP in the coming years // ArmBanks, June 16, 2026 – armbanks.am
[7] Monthly State Debt Bulletins // Ministry of Finance of the Republic of Armenia – minfin.am