The Ruble Anomaly: High Oil Prices and the Weakening Exchange Rate
Analyzing the Divergence: Surging Oil Prices and the Ruble Exchange Rate
After a pause of roughly a year, the tvyal.com newsletter resumes its regular publications. We return to examine a highly unusual currency situation of the current year. This issue is directly relevant to Armenian businesses, importers, and policymakers who monitor regional exchange rates. The central question is why the Russian ruble is depreciating at the exact moment when global oil prices are recording significant growth.
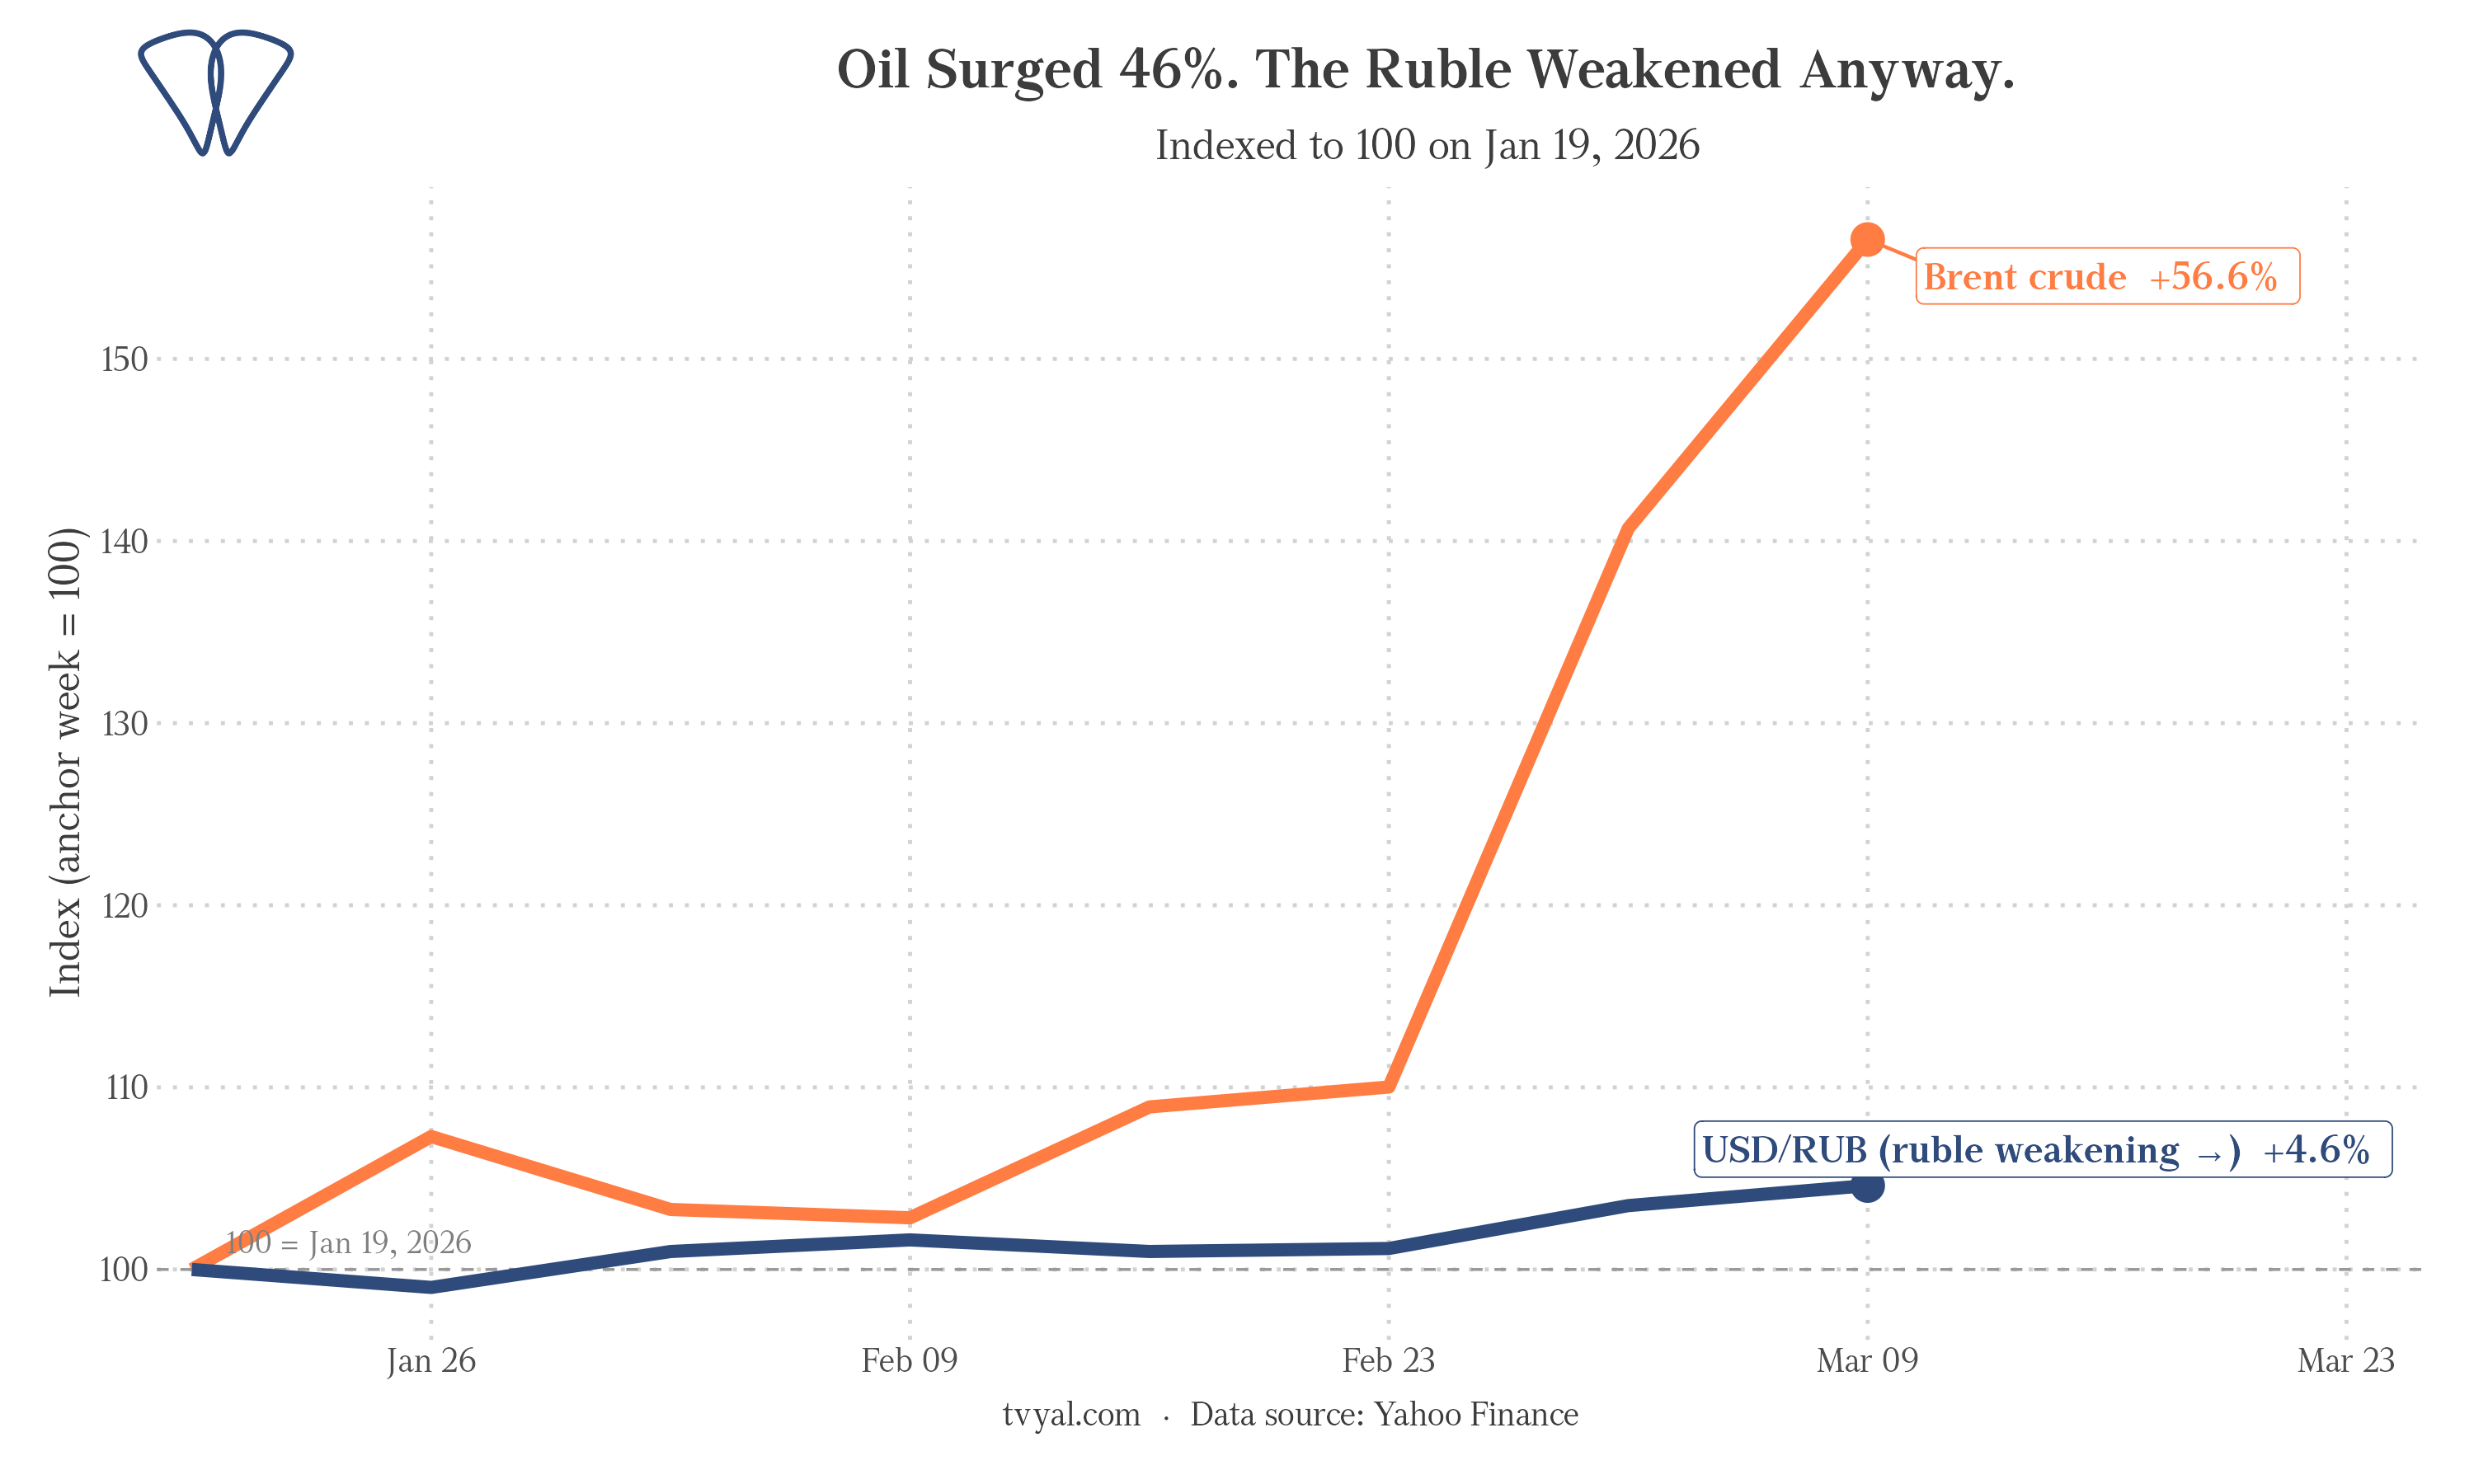
Chart 1.
The Statistical Anomaly
The traditional economic model for the Russian ruble is straightforward. When oil prices rise, Russia exports hydrocarbons, foreign currency enters the domestic market, demand for the ruble increases, and the exchange rate strengthens. Economic literature written about the Russian economy prior to 2022 consistently supports this fundamental logic.
The market dynamics in March 2026 contradict this established logic. Over the past eight weeks, Brent crude oil rose from $70.7 to $103.4 per barrel. This is a 46.3% increase driven by the escalating conflict and the actual closure of the Strait of Hormuz to commercial shipping.[1] Under normal economic conditions, a change of this magnitude would have led to a sharp appreciation of the ruble. Instead, the USD/RUB exchange rate moved from 75.2 to 83.4, meaning the ruble weakened by 10.8% during the same period.
To put this situation into perspective, oil prices increased by nearly half, yet the ruble lost more than a tenth of its value against the US dollar. This is not a random market fluctuation. It represents a clear structural signal within the economy.
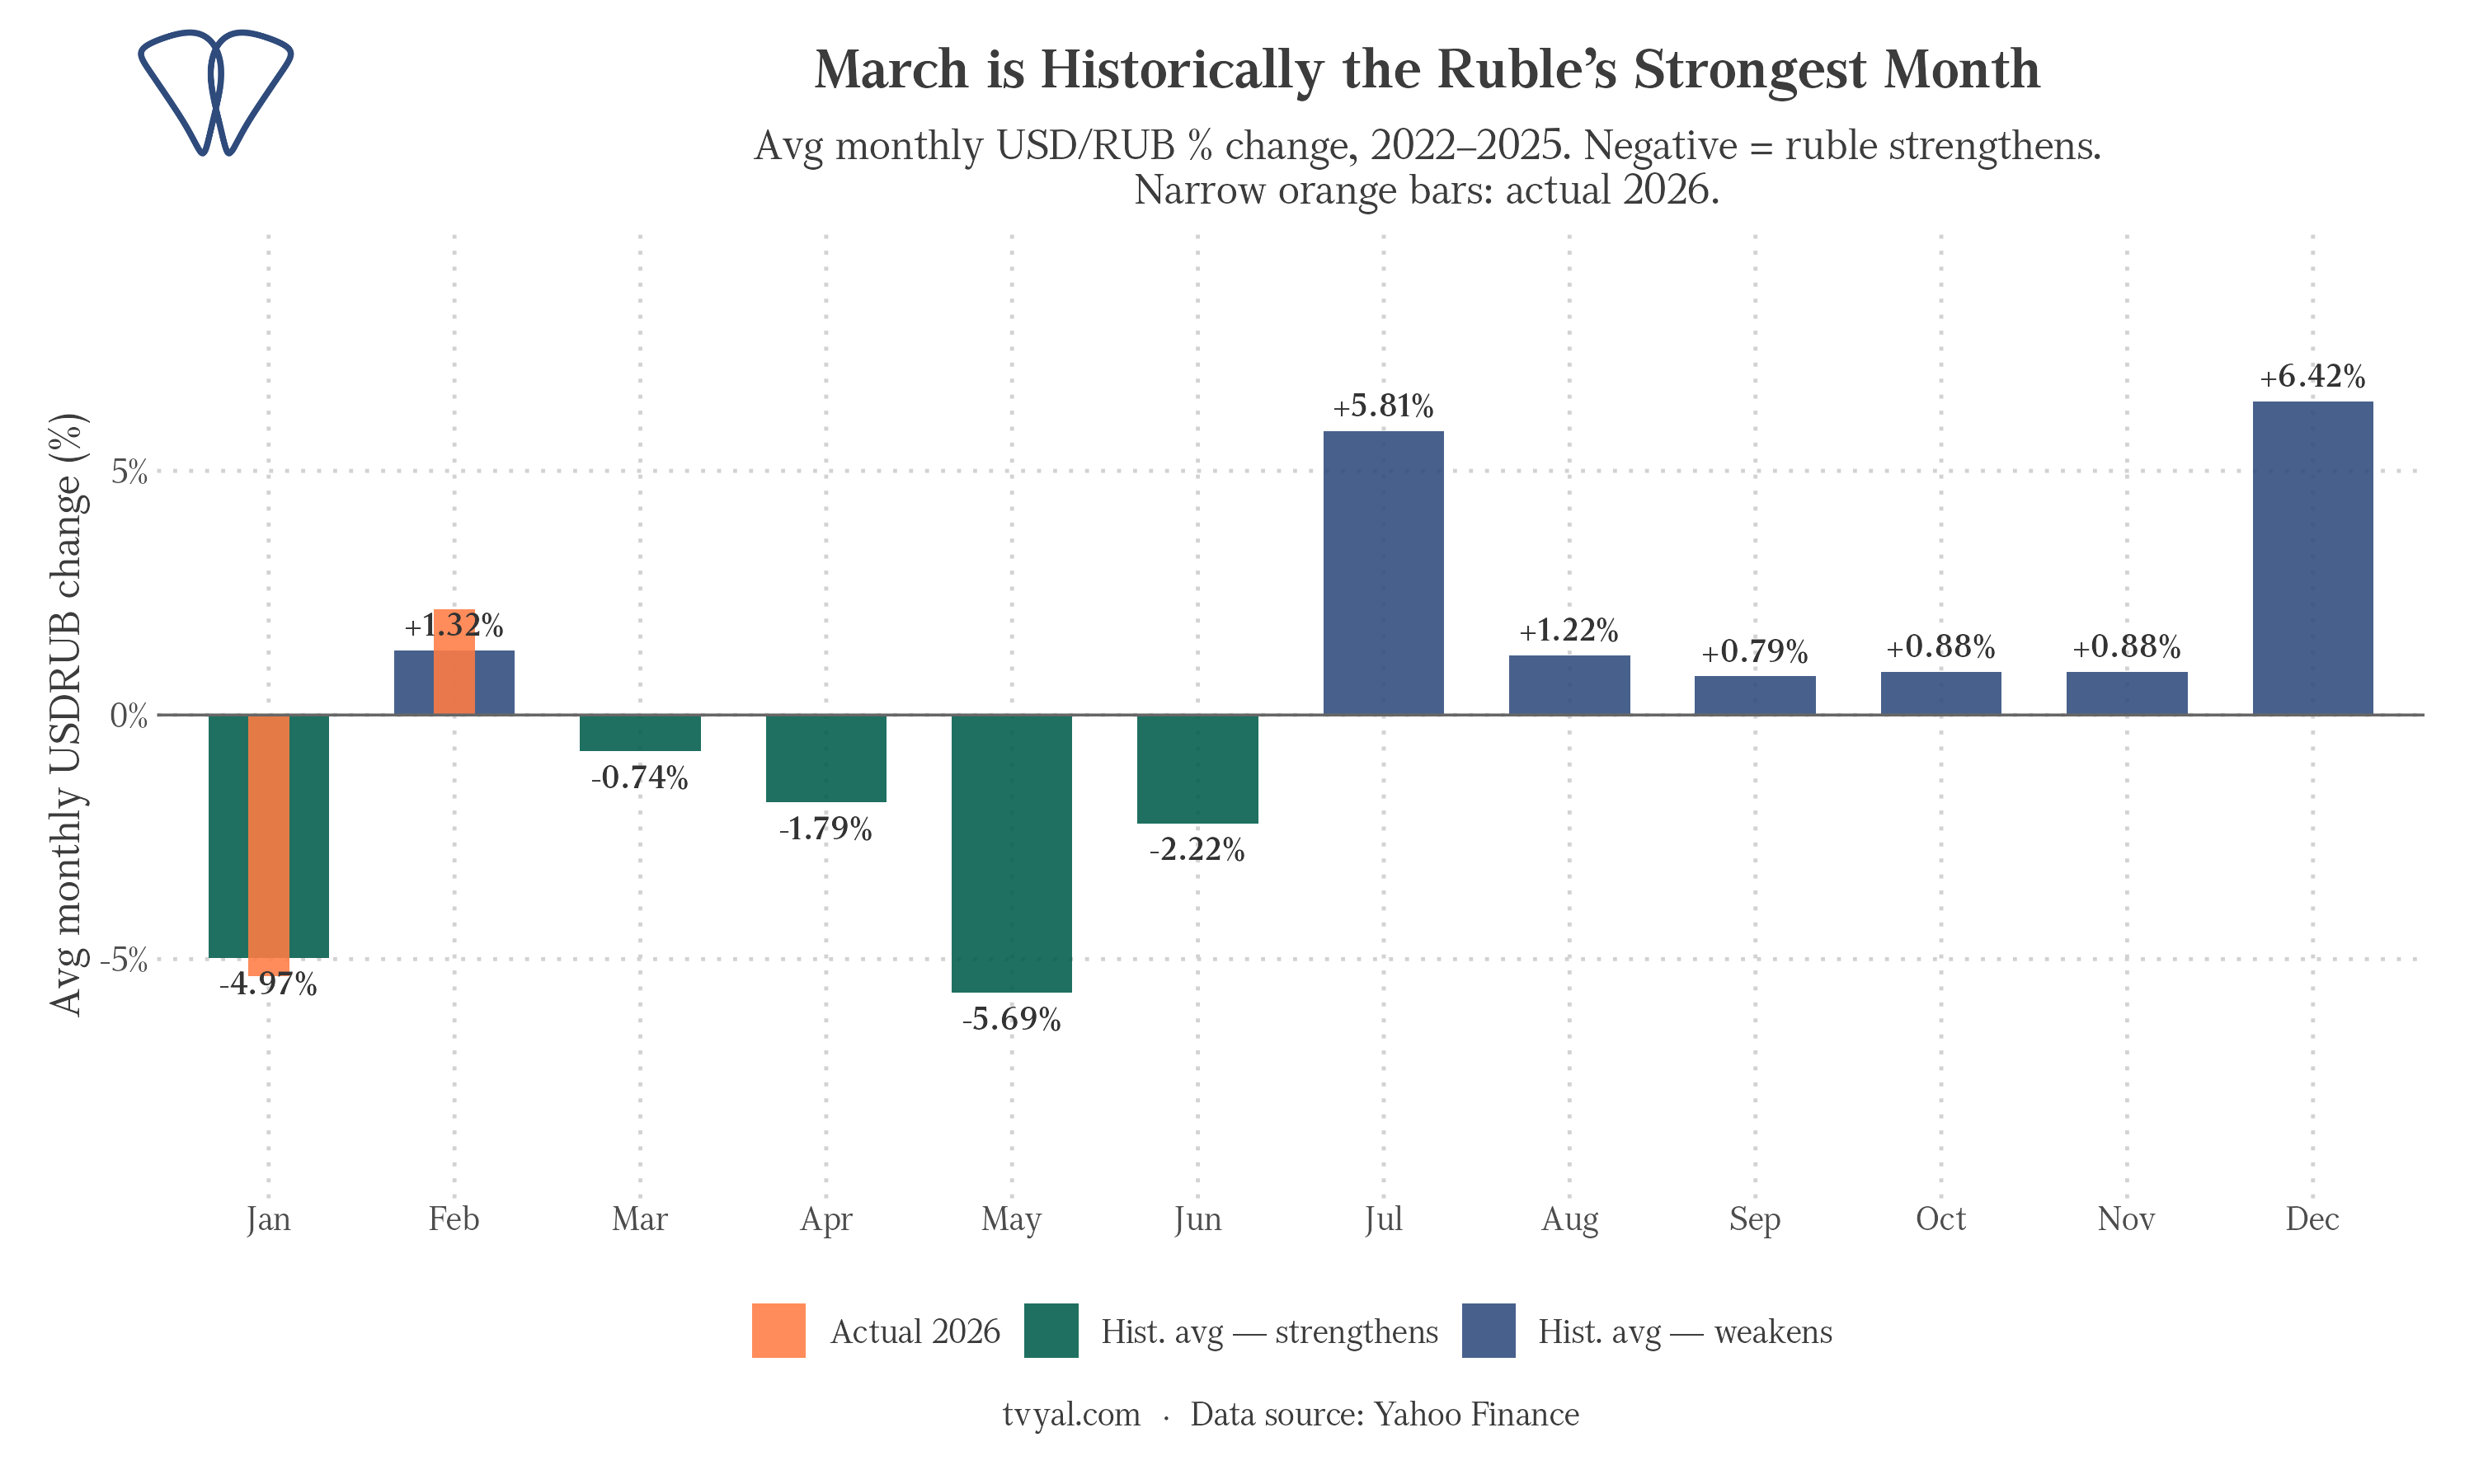
Chart 2.
Historical Context and Seasonal Patterns
Before analyzing the current anomaly, it is necessary to understand the typical behavior of the ruble in March. By examining weekly USD/RUB data from 2022 through 2025, which covers four full years of the conflict period, sanctions, and multiple economic shocks, we can calculate the average monthly trajectory of the ruble across the calendar year.
The historical data reveals a clear picture. March is statistically the strongest month for the ruble. On average, over those four years, the ruble appreciated by approximately 6.7% during March alone. The underlying mechanism is well documented. After a winter season characterized by heavy government spending and high import demand that pressures the currency, the spring tax period forces large Russian exporters to convert their foreign currency earnings to meet domestic ruble tax obligations. This mandatory conversion increases the supply of dollars and yuan in the market, leading to a stronger ruble.
January and February also traditionally show positive trends for the ruble. The entire first half of the year generally demonstrates a consistent strengthening bias in the historical data. The phase of currency weakening typically occurs from July through December. The most significant pressure is observed in November and December, aligning with the close of the Russian fiscal year and the peak of year-end government spending.
The dynamics for the current year of 2026 show the exact opposite trend. The USD/RUB exchange rate started January at 80.5 and reached 83.4 by March 18, representing a 3.6% depreciation. Compared to the historical March expectation of a 6.7% appreciation, there is a divergence of more than ten percentage points. A specific factor has altered the standard seasonal pattern.
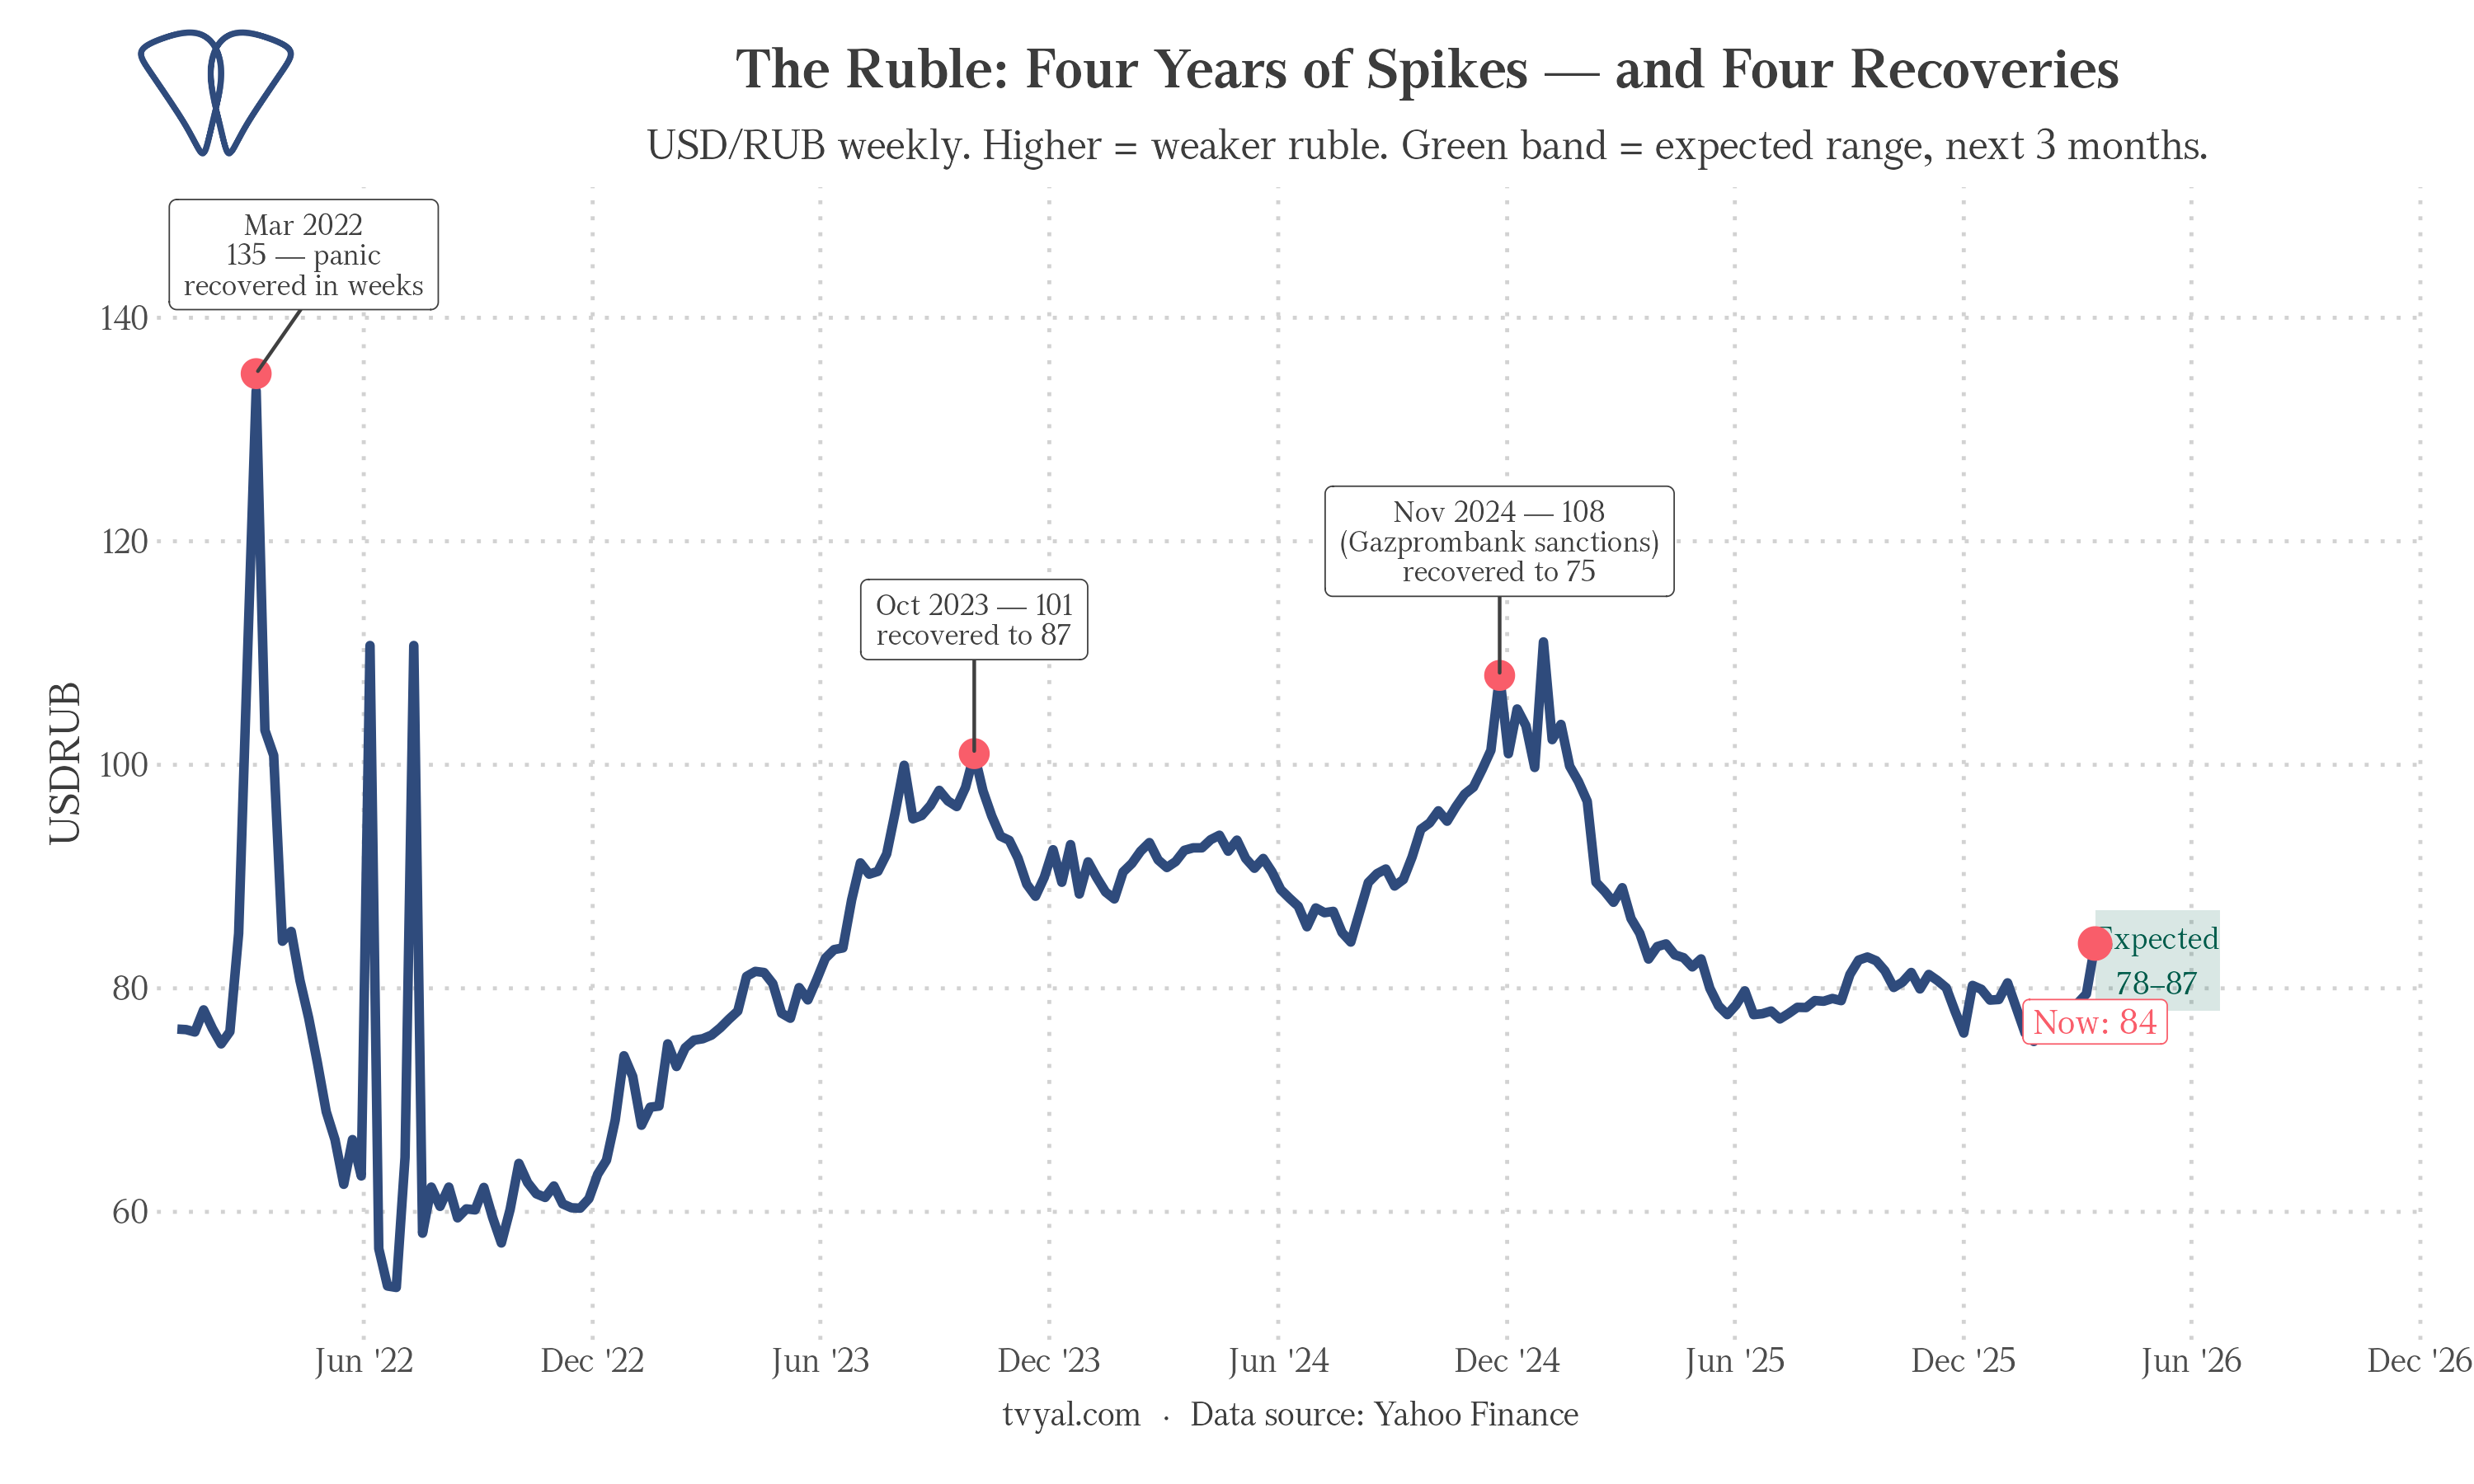
Chart 3.
The Evolution of the Ruble Exchange Rate
To comprehend why the connection between oil and the ruble has weakened, we must look at how this relationship has changed since early 2022. We can measure the rolling 12-week correlation between weekly Brent crude returns and weekly USD/RUB returns. In simple terms, this shows how strongly oil price movements predicted ruble fluctuations in each specific period.
The resulting analysis illustrates a progressive disconnection between these variables.
During the initial period from February 2022 through the end of 2023, the correlation between oil and the ruble was already showing signs of distortion. Sanctions had restricted many traditional foreign exchange settlement channels, while the Russian government was simultaneously injecting massive amounts of rubles into the economy for military procurement. An increase in oil prices did not reliably lead to a stronger ruble. In fact, during many weeks the correlation was positive, meaning oil prices rose while the ruble weakened simultaneously. This was the exact opposite of the historical relationship.
By the subsequent period from 2024 through February 2026, the correlation had dropped almost to zero. The price of oil became essentially irrelevant to the daily behavior of the ruble. The exchange rate was being managed primarily through fiscal policy, capital controls, and the interventions of the Ministry of Finance in the foreign exchange market, rather than through commodity export revenues.
In the three weeks since the Hormuz crisis began in late February 2026, a new and more defined signal has emerged. The correlation between the US dollar index (DXY) and the ruble reached -0.94. This is an exceptionally high correlation. It clearly indicates that the ruble is now moving almost entirely in response to global dollar strength and weakness, independent of oil prices. When the dollar strengthens globally, as observed during this current period of financial stress across Asia and Europe, the ruble depreciates regardless of the oil market dynamics.
The Delay in Oil Revenue Impact
The revenues from energy exports are substantial. The price of Urals crude, which had averaged around $41 to $44 per barrel in January and February, well below the state budget assumption of $59, surged to $74 to $99 per barrel by mid-March. The Russian state budget transitioned from a state of severe deficit to exceeding its benchmarks in a matter of days. The key question is why these funds are not supporting the national currency.
Three main mechanisms explain this discrepancy.
First, there is a physical time lag of 30 to 45 days between the sale of oil and the actual receipt of foreign currency. The foreign exchange flowing into Russian markets in March was generated from oil shipped in late January and February, when prices were at their lowest point. The financial windfall from the recent price surge will not reach the Moscow interbank market until April at the earliest.
Second, the Russian Ministry of Finance made a deliberate policy decision on March 4 to suspend foreign currency sales from the National Wealth Fund. Throughout early 2026, when oil revenues were comparatively low, the Ministry had been selling approximately 11.9 billion rubles worth of foreign currency per day to stabilize the exchange rate.[2] Halting those sales removed a significant daily source of dollar and yuan supply from the domestic market. This was not a sign of economic weakness. It was a calculated decision to preserve the sovereign fund and accumulate the incoming oil revenues rather than releasing them into the market immediately. As a consequence, the ruble faced short-term depreciation.
Third, a large portion of Russia’s oil trade is now settled outside the traditional dollar system. Approximately 60% of Russian export revenues arrive in rubles or yuan rather than dollars. Furthermore, the yuan settlement channel itself has been significantly restricted. Major Chinese banks, facing pressure from secondary sanctions, have become highly cautious about processing Russian payments. Revenue that is recorded on paper can take weeks or even months to convert into accessible foreign exchange within the Russian financial system.
The outcome is a classic timing mismatch. The Russian fiscal position improved dramatically in March, but the ruble did not benefit because the actual funds had not yet arrived. Concurrently, the state chose to halt its own currency sales precisely at the moment the market required them the most.
Currency Resilience and Consistent Trends
It is important to step back from short-term fluctuations to evaluate the actual trajectory of the ruble over the past four years. Every major episode of currency depreciation has been followed by a significant recovery.
In March 2022, following the initial shock of comprehensive Western sanctions, the ruble reached 135 per dollar, a level that generated predictions of total economic collapse.[5] Within weeks, it had recovered to below 80, and by mid-2022 it was stronger than its pre-war levels. In late 2023, the exchange rate touched 100 before recovering to the 85 to 90 range. In late 2024, it briefly reached 107 to 115 following a new round of financial sanctions and year-end fiscal pressures, but it subsequently recovered to 75 by early 2025.
Looking at the year-over-year data reveals a noteworthy fact. The ruble today at 83.4 is actually 3.49% stronger than it was exactly one year ago. During a period when many analysts predicted an unsustainable economic model, the ruble has essentially maintained its purchasing power on an annual basis.
The Russian economy has successfully rerouted trade, established alternative payment corridors, and adapted to sanctions[3] in ways that mainstream forecasts consistently underestimated. The behavior of the ruble reflects an economy that is under genuine structural stress, characterized by inflation, high interest rates, and a chronic budget deficit driven by military spending. However, it does not reflect an economy in a state of uncontrolled collapse.
Base Case Scenario and Future Outlook
The combination of incoming oil revenue settlements in April, the historical seasonal pattern of spring currency strength, and the demonstrated willingness of the government to defend the exchange rate through capital controls all point in a single direction. The current weakness of the ruble is highly likely to be temporary.
The realistic peak for the USD/RUB exchange rate in this current episode is the 85 to 87 range, sustained for a period of two to four weeks. The target for a reversal through May and June is between 78 and 80. This is consistent with where the ruble was trading prior to the Hormuz supply shock and aligns with the seasonal pattern that has persisted since 2022.
The scenario that would alter this base case requires two events to occur simultaneously. First, the Strait of Hormuz must fully reopen, causing oil prices to drop significantly below $65. Second, new financial sanctions must effectively close off the remaining alternative settlement channels.[4] Either development in isolation would be economically manageable. Both occurring together would push the ruble into a different structural regime, potentially driving the exchange rate toward the 90 to 95 range, where the central bank would face difficult decisions regarding interest rates.
Economic Implications for Armenia
The economy of Armenia remains closely connected to the ruble, even as policymakers have spent years attempting to diversify the external economic linkages of the country. This connection operates through three primary mechanisms. These include remittances from Armenians working in Russia, trade flows where Armenian exporters sell goods to the Russian market in rubles, and the local exchange market in Yerevan, where the ruble-to-dram spread indicates regional financial stability.
The economic episode of December 2024 serves as an instructive example. When the ruble briefly reached 115 following financial sanctions, Armenian exchange points widened their spreads sharply. The margin between buying and selling prices, which is a direct measure of market uncertainty, spiked for several weeks. The Armenian dram experienced fluctuations but remained stable overall. By the time the ruble recovered to 99 in early December, the Armenian financial market had largely absorbed the external shock without lasting negative consequences.
The current situation, with an expected peak in the 83 to 87 range rather than 115, represents a milder version of that previous financial stress. Armenian importers purchasing goods priced in rubles face a brief period of higher effective costs. Similarly, remittances arriving from the Russian Federation convert to slightly fewer drams at the margin. These are tangible economic pressures, but they remain entirely manageable.
The critical threshold to monitor is the 90 mark. If the USD/RUB exchange rate exceeds and holds above 90 for more than two consecutive weeks, it would signal that the anticipated April oil revenues have not materialized. Such a scenario would warrant a serious reassessment of dram stability and the broader implications for Armenia’s GDP growth outlook for 2026. At that point, the widening of margins in Yerevan exchange points would serve as a crucial leading indicator.
Based on the current data, the situation requires observation rather than alarm. The ruble is experiencing a temporary dislocation from its fundamental economic indicators, driven by deliberate state policy and settlement delays. For the first time in an extended period, the actual fundamentals are improving, as oil revenues are significantly exceeding budget benchmarks. The financial market is simply waiting for the physical arrival of these funds.
You can track live ruble buy and sell exchange rates at Armenian exchange points in real time at tvyal.com/rate.
Check out our previous analyses
* USDRUB and Brent weekly data sourced via Yahoo Finance (tidyquant, R). Seasonal pattern calculated from weekly returns January 2022 to December 2025. Rolling correlations computed over 12-week windows. All analysis code available on GitHub.
References
[1] Oil price expected to surge after Iran strikes and strait of Hormuz closure // The Guardian. – https://www.theguardian.com/business/2026/mar/01/oil-price-surge-iran-us-israel-strikes-markets
[2] In March, the Ministry of Finance will not conduct currency transactions under the budget rule // AK&M. – https://www.akm.ru/eng/news/in-march-the-ministry-of-finance-will-not-conduct-currency-transactions-under-the-budget-rule/
[3] Shadow fleet keeps Russia’s oil exports beyond Western reach // GIS Reports. – https://www.gisreportsonline.com/r/shadow-fleet-russia-oil/
[4] Weekly Sanctions Update: January 12, 2026 // Steptoe. – https://www.steptoe.com/en/news-publications/international-compliance-blog/weekly-sanctions-update-january-12-2026.html
[5] Stormy Weather Pummels Russia’s Economy // CEPA. – https://cepa.org/article/stormy-weather-pummels-russias-economy/